India's residential property yields still low
| Last Updated: June 29, 2017 | |||||
| BANGALORE - Apartments | PRICE/SQ.M. (US$) | YIELD (p.a.) | PRICE/SQ.FT. (US$) | ||
| TO BUY | MONTHLY RENT | TO BUY | MONTHLY RENT | ||
| Electronic City | 706 | 2.35 | 4.00% | 66 | 0.22 |
| JP Nagar | 807 | 2.77 | 4.12% | 75 | 0.26 |
| Koramangala | 1,553 | 4.35 | 3.36% | 144 | 0.40 |
| Old Madras Road | 729 | 2.43 | 4.00% | 68 | 0.23 |
| Sarjapur Road | 942 | 3.15 | 4.01% | 88 | 0.29 |
| Whitefield | 894 | 2.77 | 3.72% | 83 | 0.26 |
| Yelahanka | 808 | 2.43 | 3.61% | 75 | 0.23 |
| CALCUTTA - Apartments | |||||
| Alipore | 2,181 | 5.16 | 2.84% | 203 | 0.48 |
| Ballygunge | 1,585 | 4.32 | 3.27% | 147 | 0.40 |
| Bhawanipur | 1,617 | 4.33 | 3.21% | 150 | 0.40 |
| Gariahat | 1,600 | 4.20 | 3.15% | 149 | 0.39 |
| Jadavpur | 828 | 2.73 | 3.96% | 77 | 0.25 |
| Jodhpur Park | 1,227 | 3.35 | 3.28% | 114 | 0.31 |
| Kasba | 809 | 2.92 | 4.33% | 75 | 0.27 |
| Lake Gardens | 941 | 3.15 | 4.02% | 87 | 0.29 |
| Rajarhat | 721 | 2.15 | 3.58% | 67 | 0.20 |
| Salt Lake | 874 | 2.72 | 3.73% | 81 | 0.25 |
| NEW DELHI - Apartments | |||||
| Anand Niketan | Unlock | Unlock | Unlock | Unlock | Unlock |
| Defence Colony | Unlock | Unlock | Unlock | Unlock | Unlock |
| Greater Kailash | Unlock | Unlock | Unlock | Unlock | Unlock |
| Hauz Khas | Unlock | Unlock | Unlock | Unlock | Unlock |
| Janakpuri | Unlock | Unlock | Unlock | Unlock | Unlock |
| New Friends Colony | Unlock | Unlock | Unlock | Unlock | Unlock |
| Panchsheel Park | Unlock | Unlock | Unlock | Unlock | Unlock |
| Punjabi Bagh | Unlock | Unlock | Unlock | Unlock | Unlock |
| Saket | Unlock | Unlock | Unlock | Unlock | Unlock |
| Vasant Vihar | Unlock | Unlock | Unlock | Unlock | Unlock |
| SOUTH MUMBAI | |||||
| Breach Candy | Unlock | Unlock | Unlock | Unlock | Unlock |
| Colaba | Unlock | Unlock | Unlock | Unlock | Unlock |
| Cuffe Parade | Unlock | Unlock | Unlock | Unlock | Unlock |
| Cumbala Hill | Unlock | Unlock | Unlock | Unlock | Unlock |
| Malabar Hilla | Unlock | Unlock | Unlock | Unlock | Unlock |
| Napeansea Road | Unlock | Unlock | Unlock | Unlock | Unlock |
| Nariman Point | Unlock | Unlock | Unlock | Unlock | Unlock |
| Walkeshwar | Unlock | Unlock | Unlock | Unlock | Unlock |
| Worli | Unlock | Unlock | Unlock | Unlock | Unlock |
|
All yields are gross - i.e., before taxes, repair costs, ground rents, estate agents fees, and any other costs. Net yields (what you'll really earn) are typically around 1.5% to 2% lower. Source: Makaan Definitions: Data FAQ See also: Update Schedule |
|||||
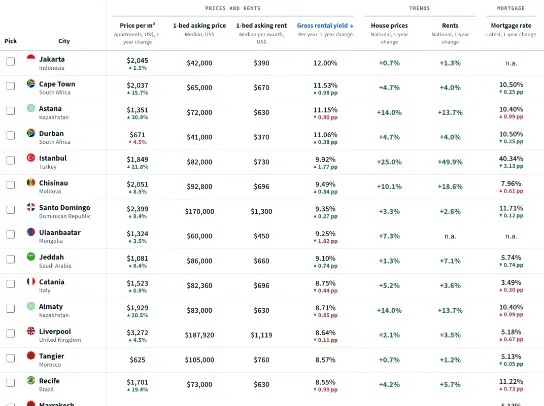
Residential property prices have risen strongly in India in recent years (see our home price charts for India). Rents have not kept pace, so it is hardly surprising that the gross rental yield - i.e., the percentage return on your purchase of property - is low in India's major cities.
South Mumbai has very low rental yields, with property investors earning around 2.40% gross. Apartments remain expensive, at about US$10,900 per square metre (sq.m.) for 120 sq.m. apartments, making Mumbai the world's 13th most expensive city for the property buyer. It is unlikely that after costs and depreciation a property buyer will make any return on his property.
In New Delhi, prices per sq. m. are of course much lower, despite the continuous price rises in that city. In 2017, the price per sq. m. of a 120-sq.m. apartment in New Delhi was between US$2,000 and US$4,500. Gross rental yields in Delhi are extremely poor, at around 2.00% gross.
In Bangalore, prices are around US$700 to US$1,500 per sq. m. Rental yields are higher in Bangalore, ranging from 3.35% to 4.12%. Again, this is a long way below the nice yields of 7.16% to 9.92% which could be obtained way back in the year 2007.
In Calcutta, prices per sq. m. range from US$700 to US$2,100 per sq. m. Rental yields are higher than in New Delhi, ranging from 2.80% to 4.00%.
Conclusion: Indian gross rental yields are very low. This suggests that Indian residential property is somewhat overvalued. While low rental yields do not always indicate over-valuation, especially in periods when interest rates are low, they are only justified if rapid economic growth is expected, and also, if there are sufficient restrictions on new building to prevent the market being flooded with new properties as prices rise. The buyer must ask himself whether these two conditions are met in India.
Round trip transaction costs are moderate to high in India. See our Property transaction costs analysis for India and Property transaction costs in India, compared to the rest of Asia