Robust housing market in Luxembourg
Luxembourg's housing market has stopped falling, but it has not started rising either. Transaction volumes are back near pre-crisis levels on the second-hand market, prices are creeping up at roughly the rate of inflation, and the off-plan segment remains broken. Into that stalemate the government has thrown the largest package of housing tax measures in years, just as the European Central Bank raised interest rates for the first time since 2023.
This extended overview from Global Property Guide covers key aspects of the Luxembourg housing market and takes a closer look at its most recent developments and long-term trends.
Table of Contents
- Property Prices and Price Index
- House Price Variations
- Property Demand Trends
- Property Supply Trends
- Rental Market: Rents and Rental Yields
- Mortgage Market and Interest Rates
- Historic Perspective
- Economic and Social Factors
All euro conversions in this report use a single reference rate, EUR 1 = USD 1.159, the market rate on 2 September 2026.
Property Prices and Price Index
The hedonic house price index compiled by STATEC, Luxembourg's national statistics agency, rose by 1.7% in the year to Q1 2026 and by 0.7% over the quarter. Set against national consumer price inflation of 1.6% over the same twelve months, that is a real gain of about 0.1%. After the correction of 2023 and the volatility of 2025, Luxembourg house prices are now moving at almost exactly the pace of everything else households buy.
The averages conceal a wide spread between segments.
Luxembourg's house price annual change:
Existing houses rose 3.0% over twelve months and 3.2% over the quarter alone, the strongest of any segment. Existing apartments rose 0.9% year on year but were flat over the quarter, at minus 0.2%. New-build apartments sold off-plan, known locally as VEFA sales, also rose 0.9% over twelve months but fell 2.2% over the quarter. The Observatoire de l'Habitat attributes much of that volatility to composition effects, since so few off-plan units now change hands that the mix of what sells moves the index.
The separate series of average prices actually paid in notarial deeds tells a sharper story. Existing apartments changed hands at an average of EUR 7,695 (US$8,918) per square metre in Q1 2026, up 0.8% from EUR 7,636 (US$8,850) a year earlier. New-build apartments averaged EUR 9,596 (US$11,122) per square metre, down 6.7% from EUR 10,289 (US$11,925).
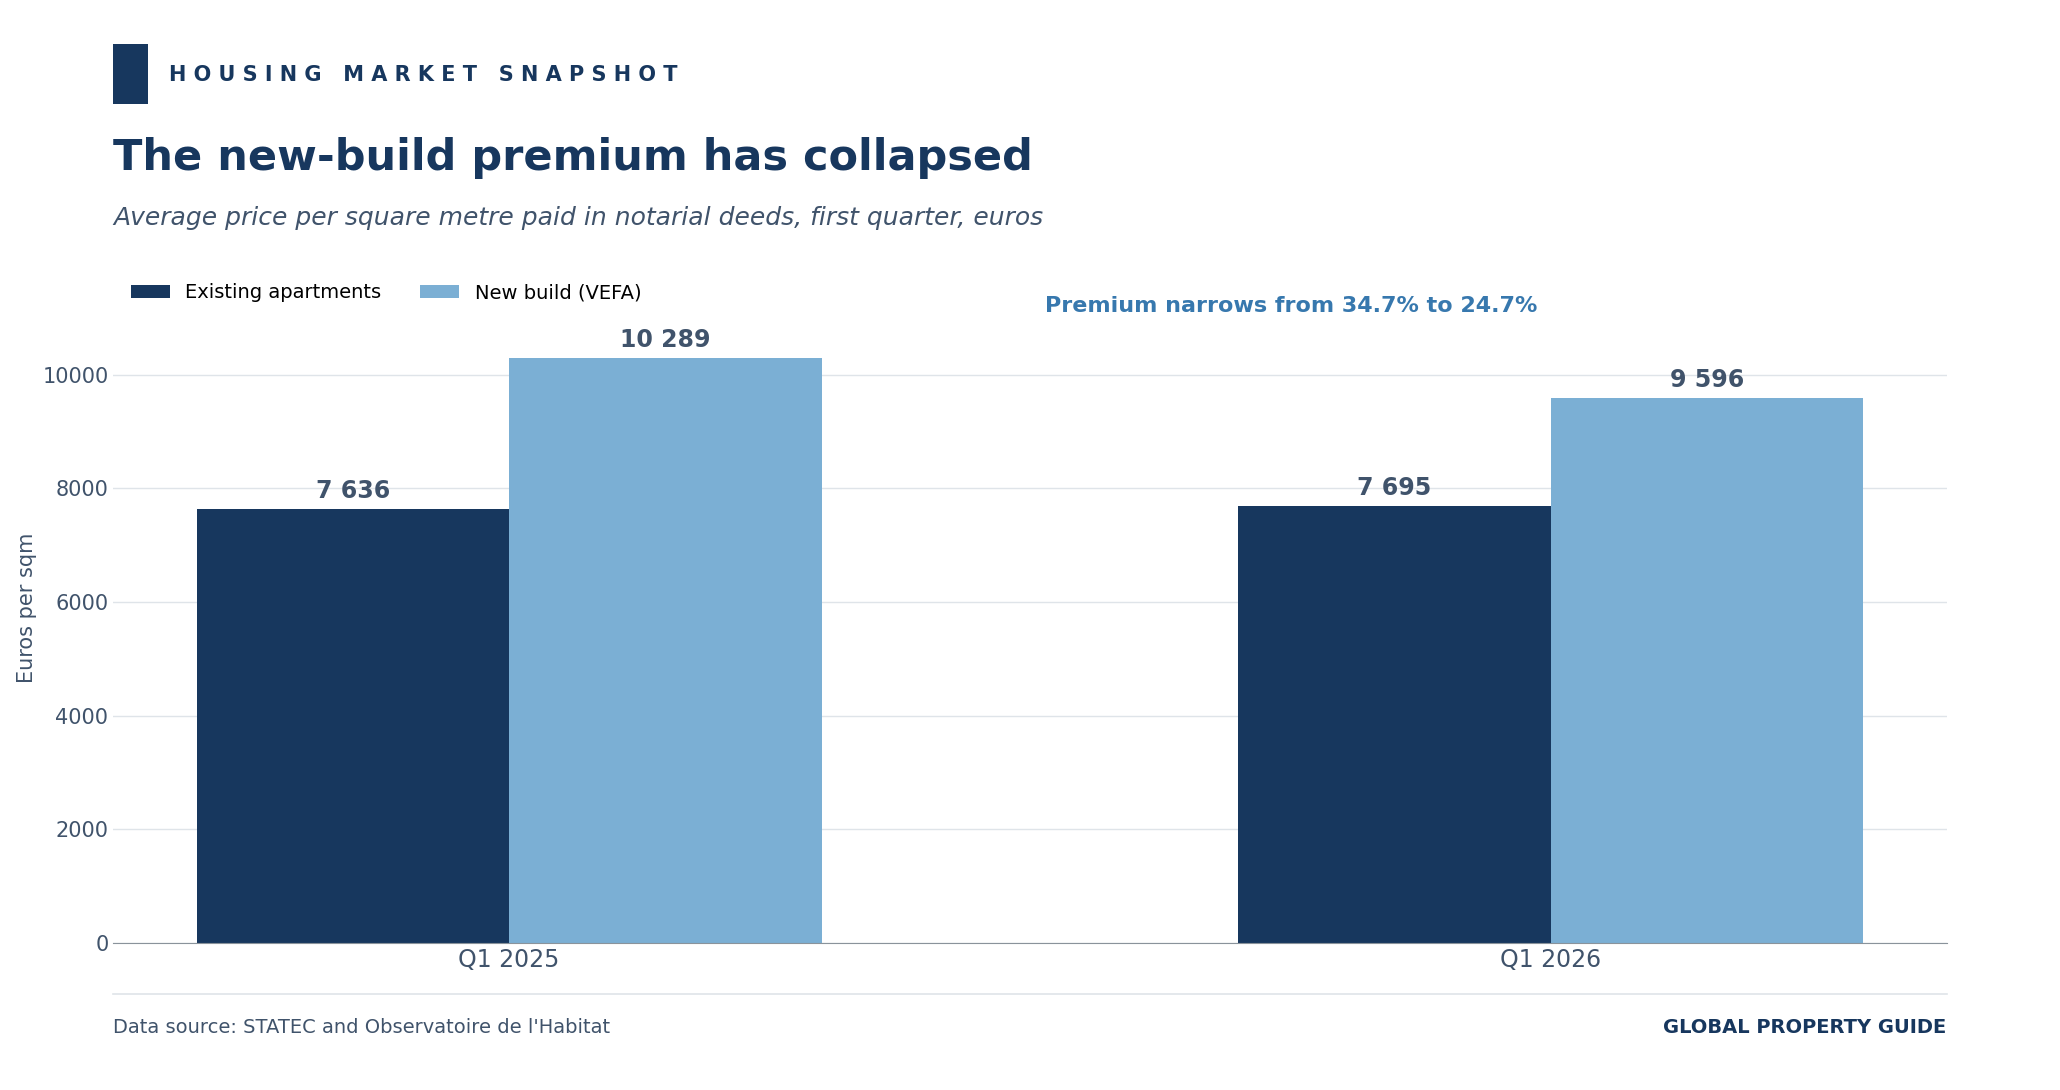
The Observatoire notes that the fall in the off-plan price per square metre reflects a sharp increase in the average floor area of the units sold rather than a discount on comparable stock. The average price of a complete off-plan apartment was almost unchanged at about EUR 710,569 (US$823,549), down 0.1% year on year.
The consequence is still striking. The premium a buyer pays per square metre for a new-build apartment over an existing one has narrowed from 34.7% in Q1 2025 to 24.7% in Q1 2026. Developers are selling larger units at lower unit prices to move stock.
House Price Variations
Distance from the capital remains the dominant explanation of price in Luxembourg. The Observatoire de l'Habitat publishes average prices per square metre for existing apartments by commune, and the range across a country 82 kilometres long is wide.
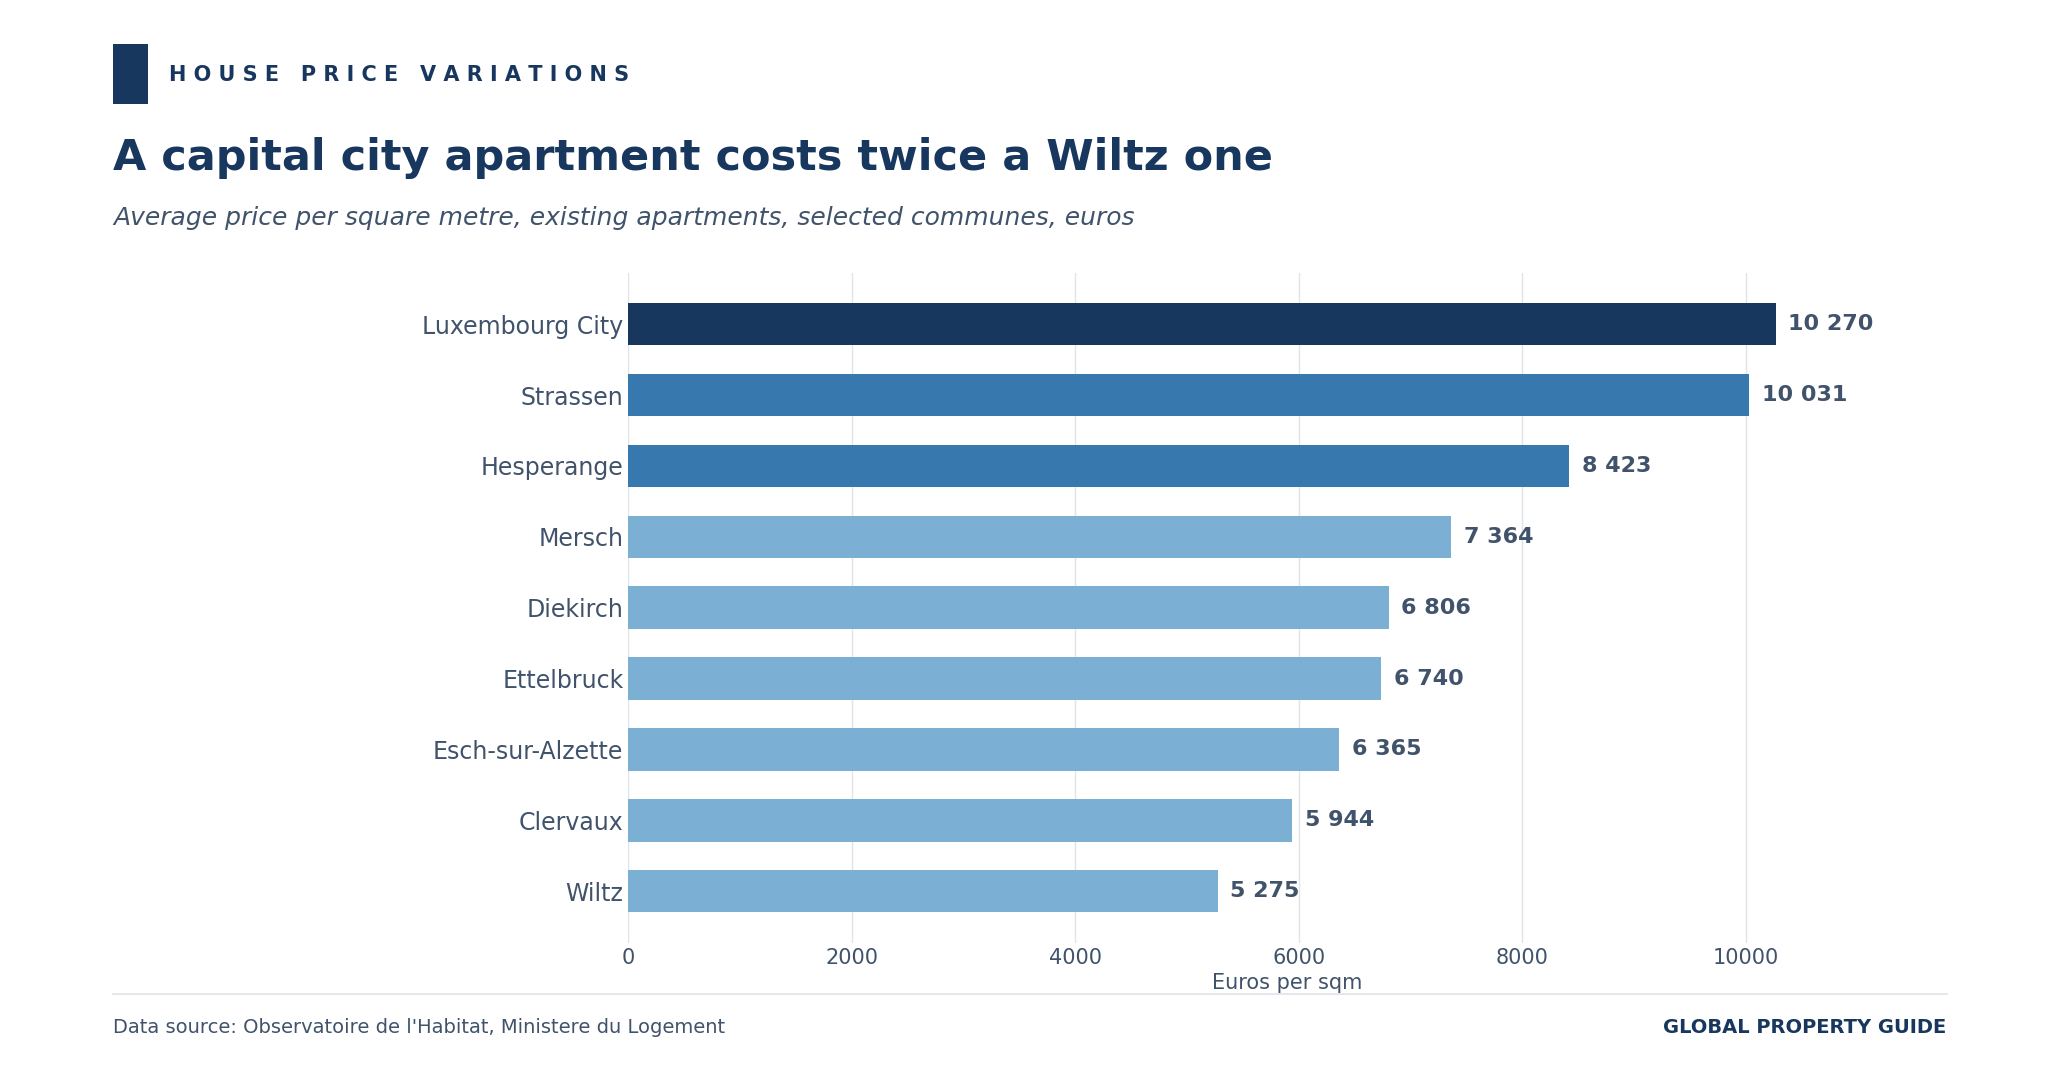
Luxembourg City averaged EUR 10,270 (US$11,903) per square metre, and Strassen, immediately to its west, EUR 10,031 (US$11,626). At the other end, Wiltz in the north averaged EUR 5,275 (US$6,114) and Clervaux EUR 5,944 (US$6,889). An apartment in the capital costs almost exactly twice one in Wiltz.
Unit size matters as much as location. Existing apartments below 50 square metres traded at an average of EUR 9,357 (US$10,845) per square metre, against EUR 8,339 (US$9,665) for units of 130 square metres and above. Kitchens and bathrooms are fixed-cost rooms, and they occupy a larger share of a small flat.
The correction reached the capital too
The decline of 2022 to 2025 was not confined to the periphery. The Observatoire found that existing apartment prices fell about 11% in Luxembourg City over that period, and by as much as 18% in some towns. The capital fell less than the country as a whole, which is why the gradient between centre and periphery has, if anything, steepened.
Property Demand Trends
The second-hand market has almost fully recovered
Total apartment transactions reached 1,175 units in Q1 2026, up 3.3% on Q1 2025 and 2.6% on the previous quarter, according to the Observatoire de l'Habitat. That headline conceals two markets moving in opposite directions.
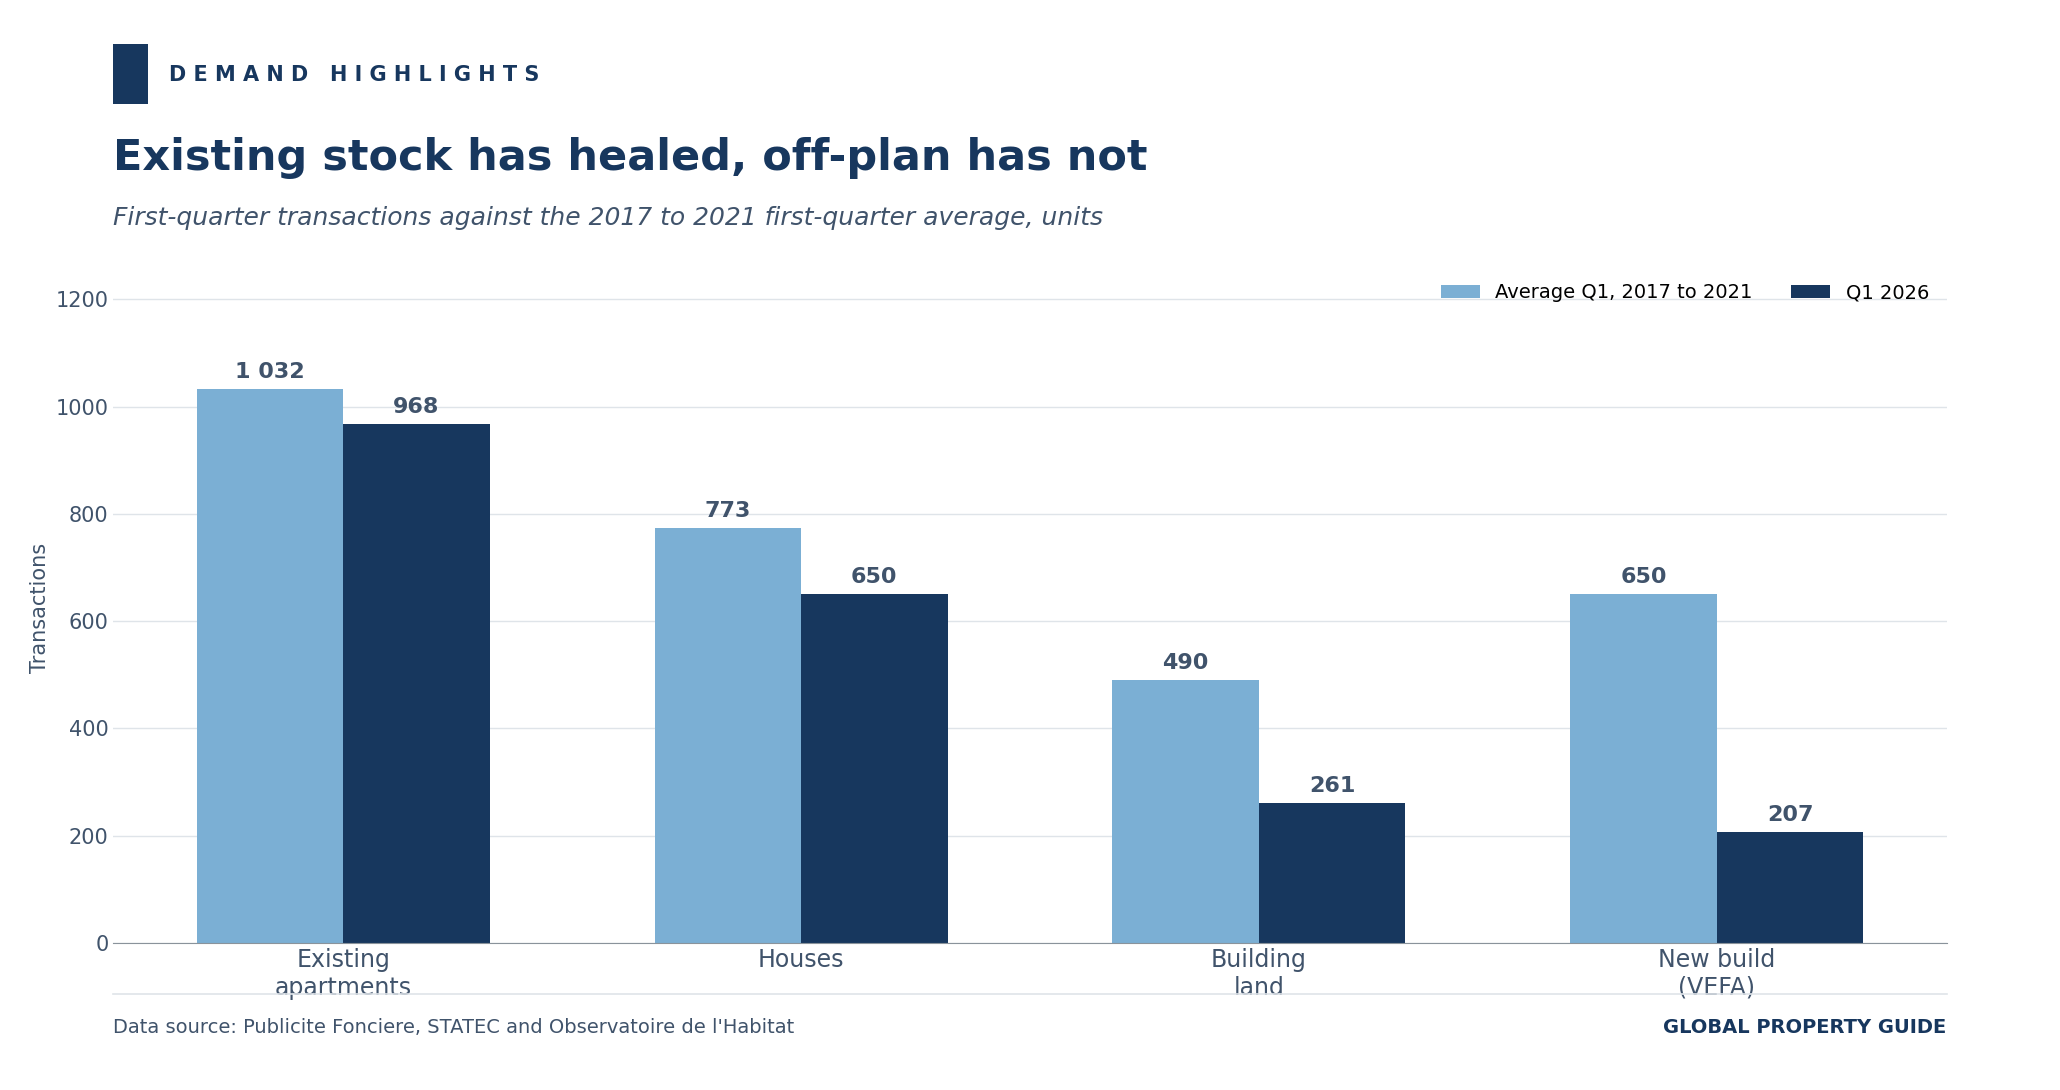
Existing apartment sales rose 9.4% year on year to 968 units, which is 93.8% of the 1,032 average recorded in first quarters between 2017 and 2021. On that measure, the second-hand apartment market has essentially normalised. House sales rose 11.5% to 650 units, or 84.1% of their pre-crisis first-quarter average of 773. Building land transactions rose 2.8% to 261, but that is only 53.3% of the 490 first-quarter average.
Off-plan sales went the other way, falling 18.2% year on year to 207 units. That is 31.8% of the pre-crisis first-quarter average of about 650. The segment did improve 38.9% on the previous quarter, when just 149 units sold, but it remains the clear weak point of the market.
The financial volume behind those apartment sales was about EUR 720 million (US$834 million), down 8.9% year on year and 5.6% on the previous quarter.
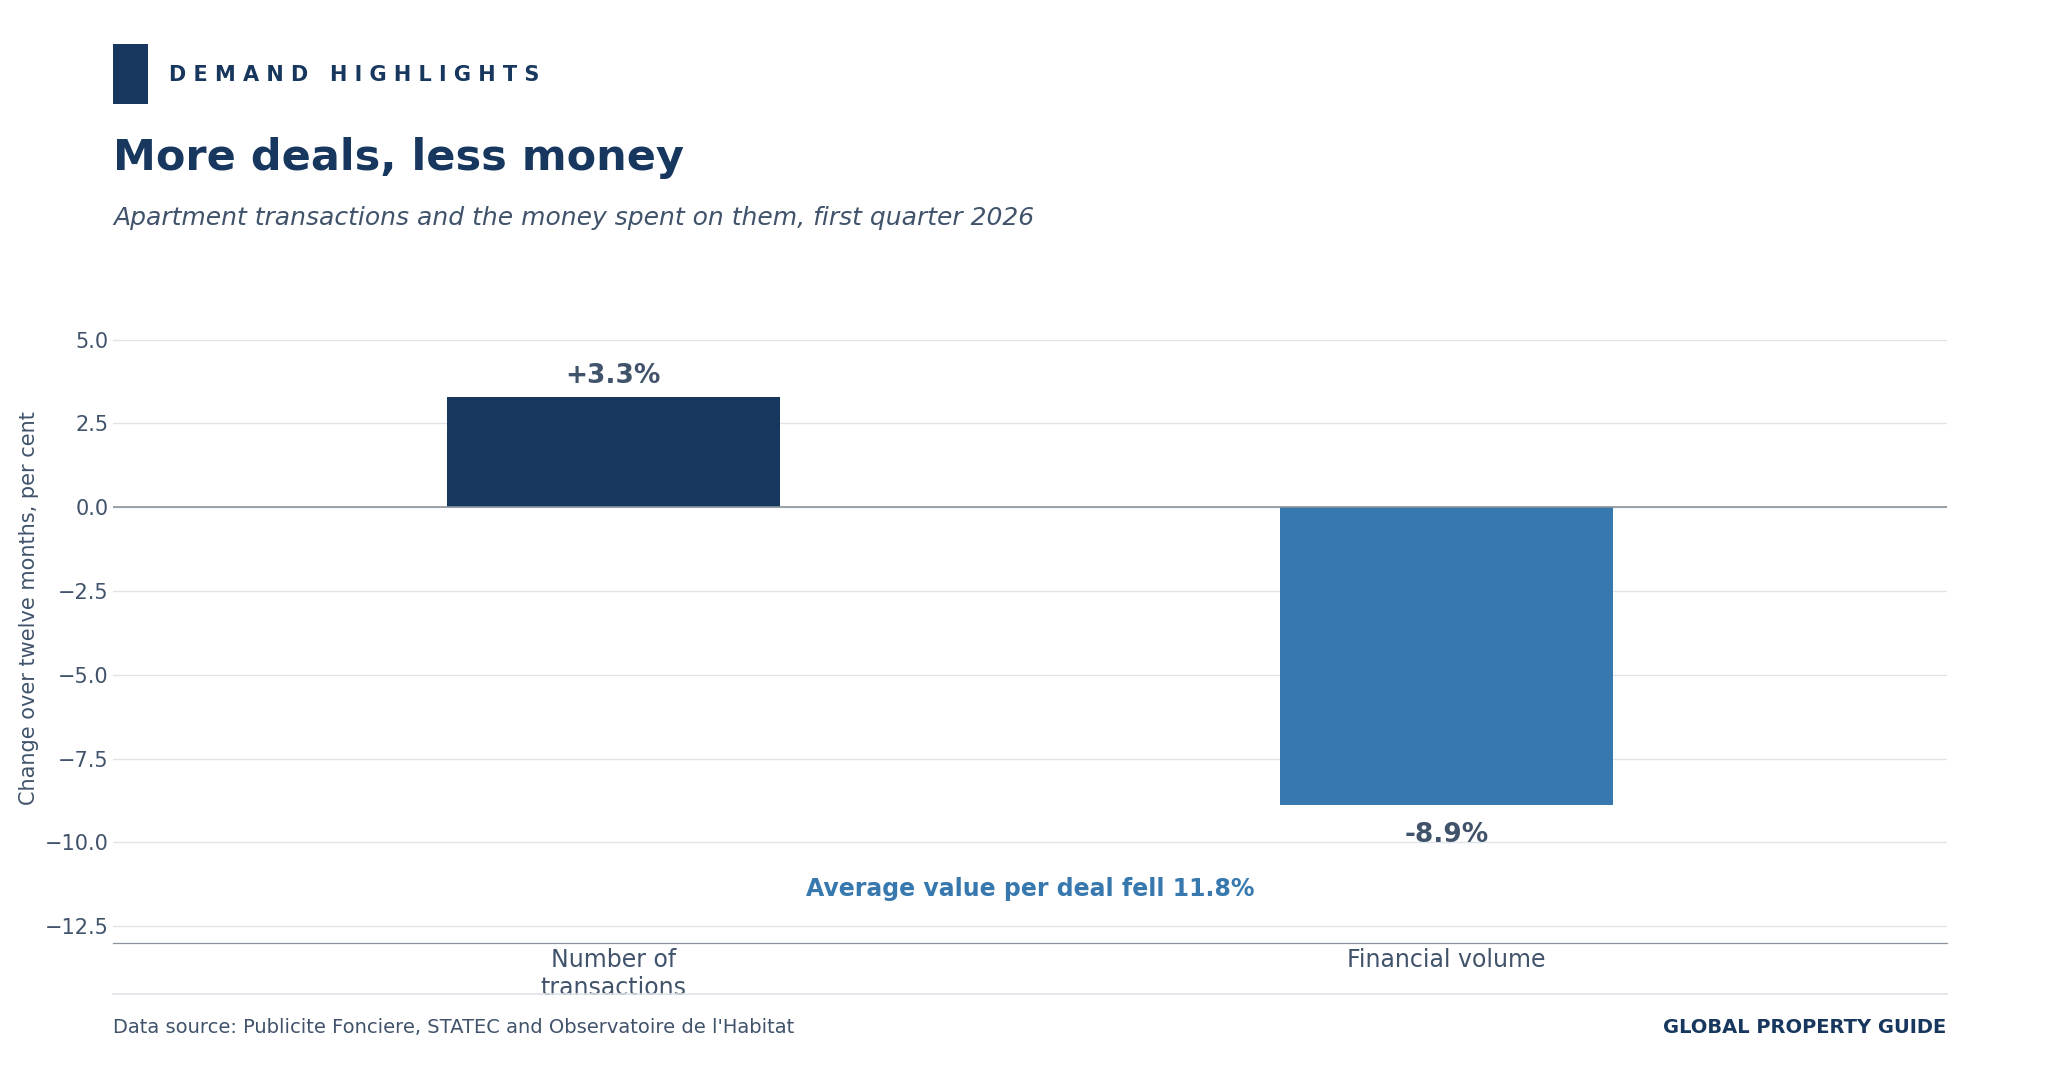
A 3.3% rise in the number of deals alongside an 8.9% fall in their combined value implies that the average value per transaction dropped 11.8%. Buyers are transacting more often, at lower price points. The average apartment deal in Q1 2026 was worth about EUR 613,000 (US$710,000). Off-plan sales accounted for about EUR 151 million (US$175 million) of the total, and building land sales for about EUR 169 million (US$196 million), the latter up 16.5% year on year on only a 2.8% rise in transactions.
Ownership has stopped falling
Foreigners can freely buy property in Luxembourg, and there are no nationality-based restrictions on owning land or commissioning building work.
The homeownership rate reached 64.1% in 2025, up from 63.5% in 2024, according to Eurostat's EU-SILC survey. That ends a run of sharp declines and is the first increase since 2017.
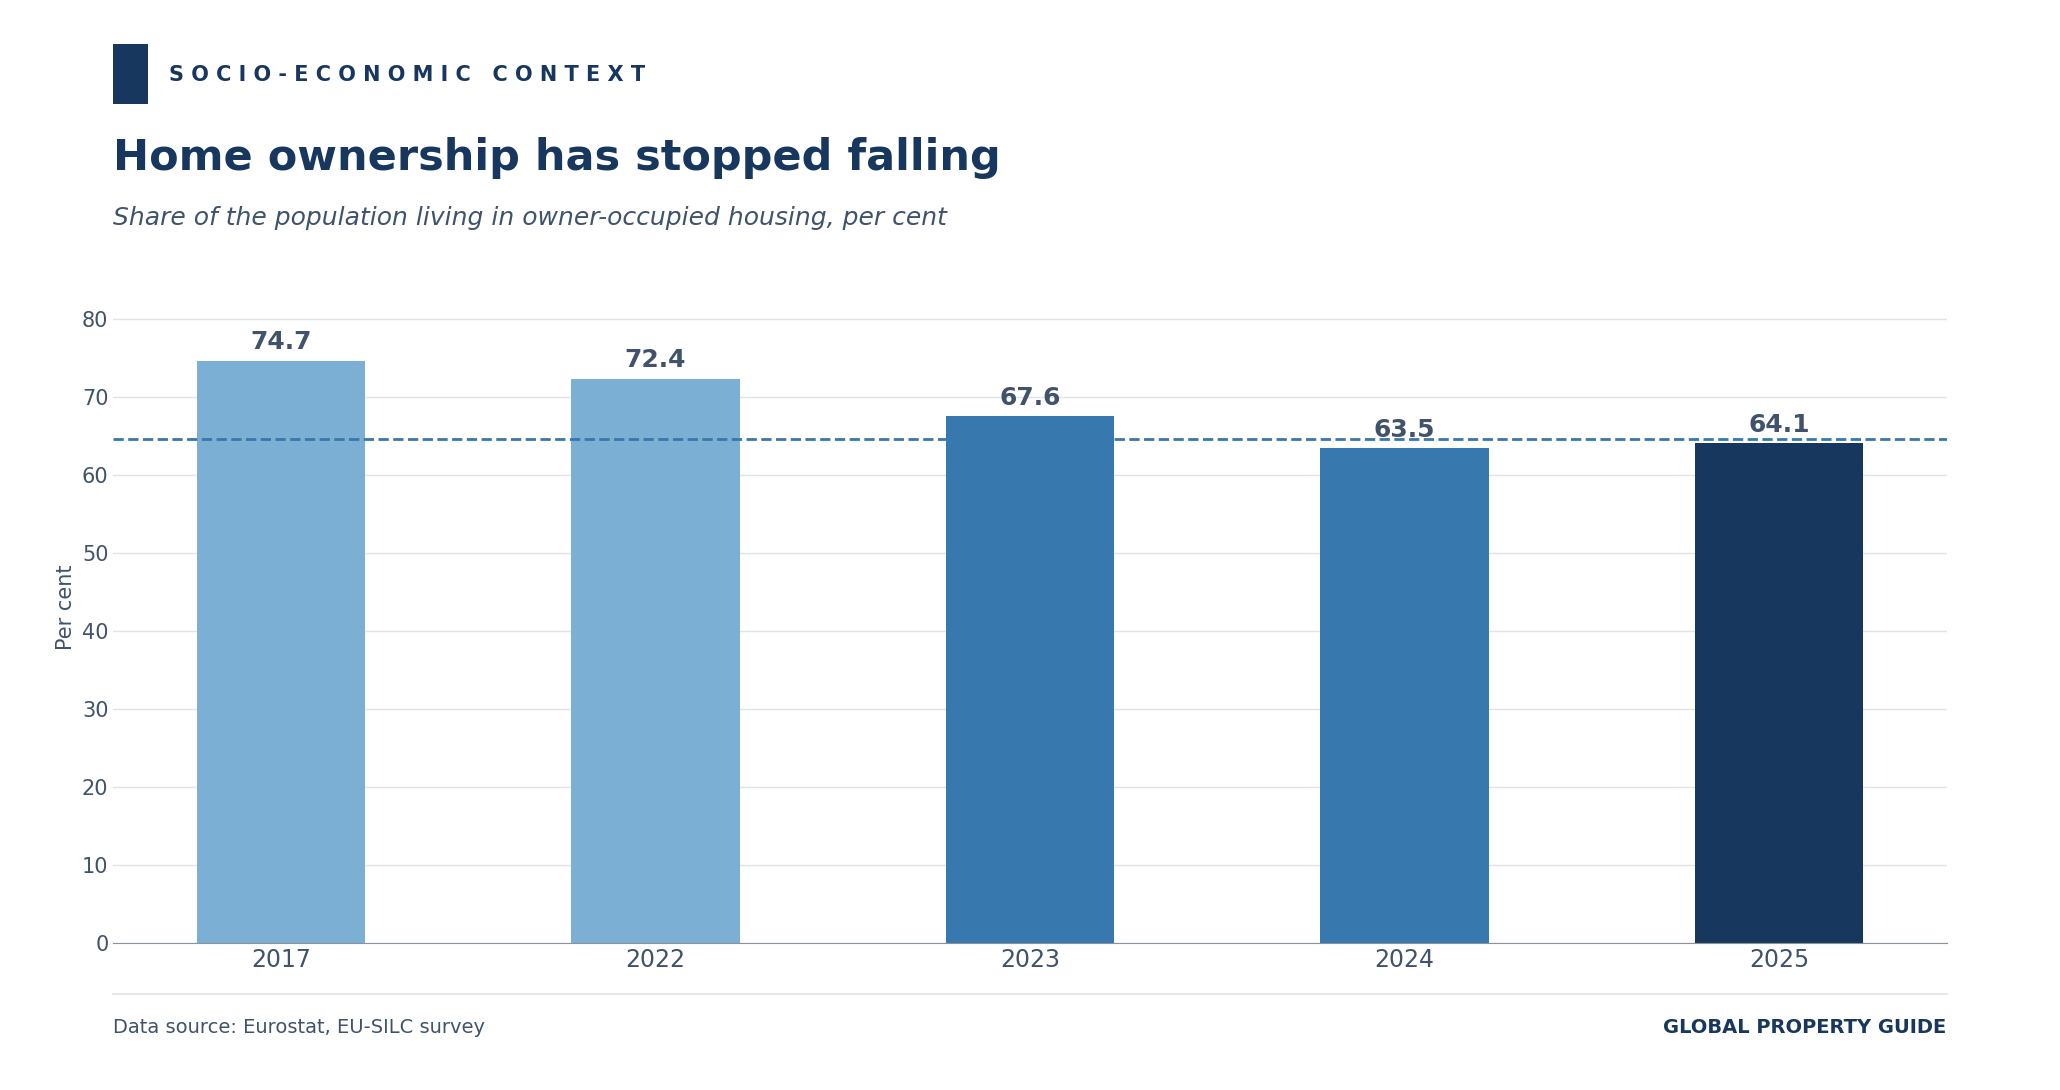
The recovery is modest. Luxembourg remains 10.6 percentage points below its 2017 peak of 74.7% and still sits just under the euro area average of 64.7%. The prior edition of this report described homeownership as continuing to fall; on the latest survey, that is no longer the case.
Property Supply Trends
Permits fell for a fourth consecutive year
Residential building permits declined again in 2025. STATEC recorded 3,404 dwellings authorised, down 12% on the previous year, with the useful floor area authorised down about 15%.
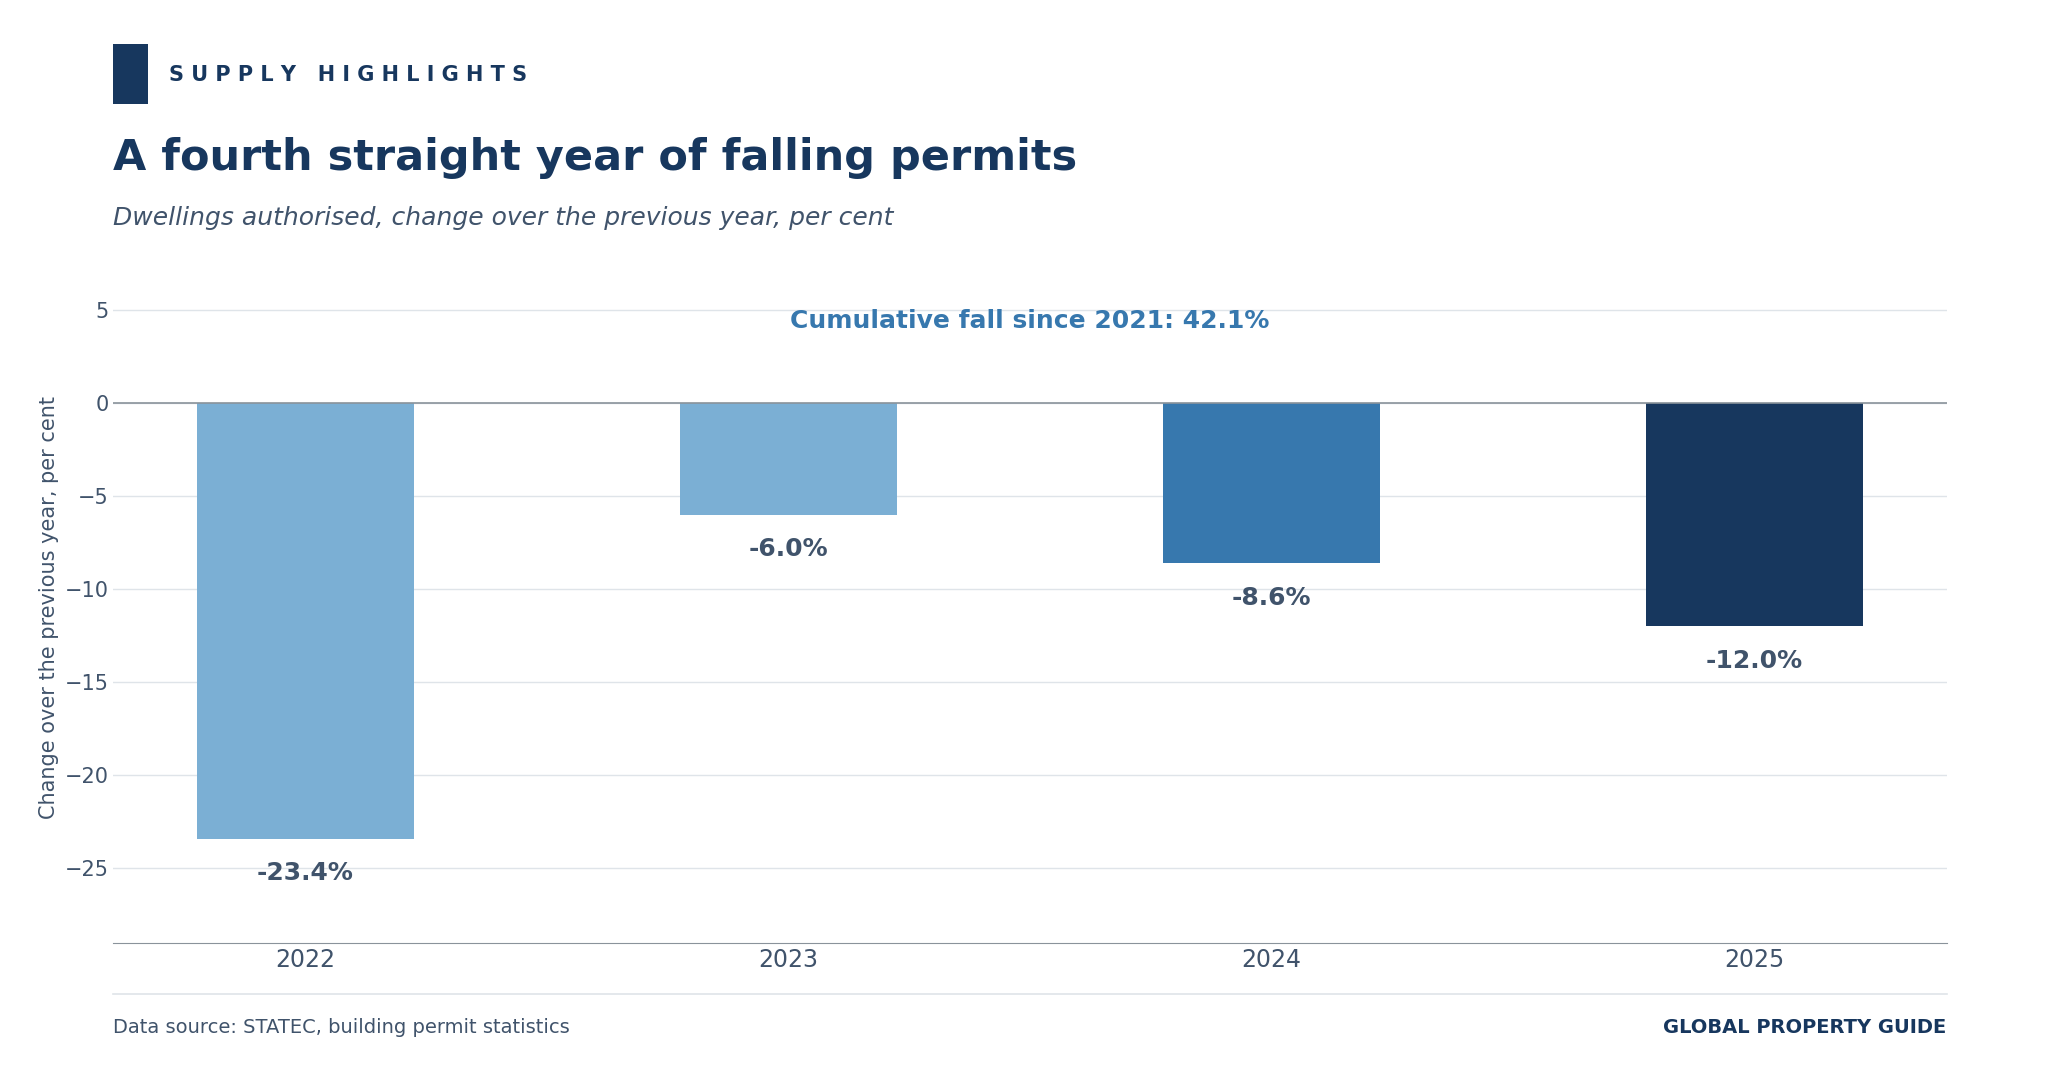
Compounding the annual falls of 23.4% in 2022, 6.0% in 2023, 8.6% in 2024 and 12.0% in 2025 gives a cumulative decline of 42.1%. Against an annual housing requirement generally estimated at around 6,200 units, the 2025 permit count covers roughly 55% of need. Non-residential permits rebounded strongly in 2025, lifting the overall permit total, but STATEC notes that authorised dwelling numbers in Luxembourg and its neighbours remain well below 2019 levels.
The 2025 decline was not evenly distributed.
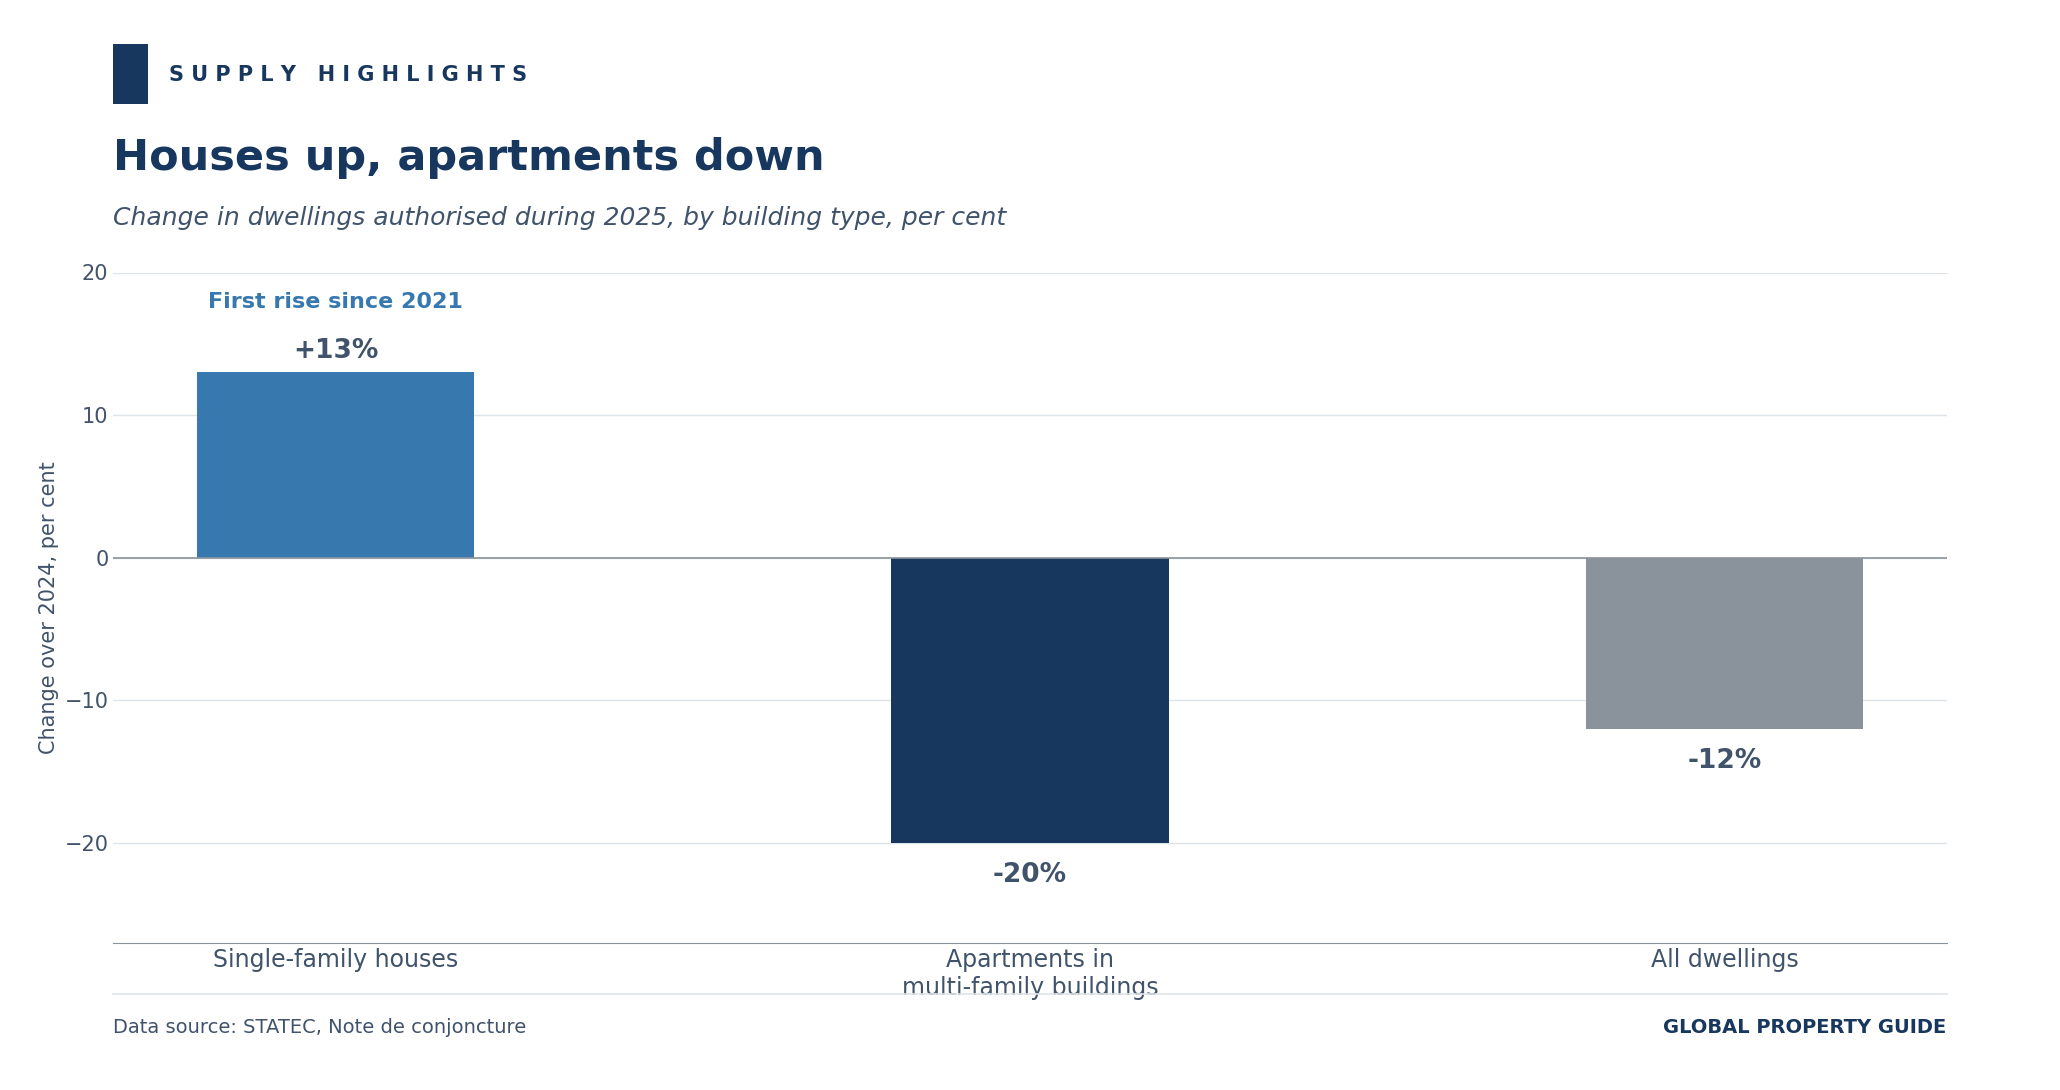
Permits for apartments in multi-family buildings fell 20%, while permits for single-family houses rose 13%, their first increase since 2021. This is the mirror image of the transaction data, where existing houses are both the fastest-appreciating and the fastest-recovering segment. Developers are retreating from the apartment blocks that Luxembourg's density needs, while individual builders return to detached housing.
The government has responded with a seven-measure package
On 16 July 2026, Housing Minister Claude Meisch and Finance Minister Gilles Roth presented "Booster fir de Wunnengsbau", a package aimed at construction, affordability and supply. It follows the expiry on 30 June 2025 of the earlier temporary housing tax measures. The seven measures are:
- Off-plan duty exemption. Individuals buying a principal residence off-plan pay registration and transcription duties on the land value only, provided the building is at most 80% complete at acquisition. Applies to VEFA deeds concluded from 16 July 2026, for three years.
- Bellegen Akt raised. The tax credit on notarial deeds rises from EUR 40,000 to EUR 45,000 (US$52,155) per individual, enough to buy a property worth about EUR 640,000 (US$741,760) free of registration duty.
- Reduced VAT for social rental housing. A rate of 8% replaces the standard 17% for creating social-purpose rental housing, subject to a 120 square metre size cap, a price per square metre at or below the Observatoire's regional median, a rental yield capped at 4% of net capital invested, a ten-year letting commitment and a certified eligible tenant.
- Accelerated depreciation. A "three times six" regime allows 6% depreciation a year for six years where the depreciable base is at most EUR 600,000 (US$695,400) per building, with 2% on the whole base above that threshold.
- Housing Bond. A EUR 250 million (US$290 million) citizen bond to fund affordable housing, with interest exempt from the 20% final withholding tax, is planned for early 2027.
- Enhanced individual aid. The subsidised loan ceiling rises to EUR 300,000 (US$347,700) where at least one borrower is aged 35 or under, and to EUR 250,000 generally, with the per-child supplement rising from EUR 20,000 to EUR 30,000.
- State off-plan purchases. A further EUR 300 million (US$348 million) is added to the VEFA acquisition programme, whose first EUR 480 million envelope allowed the State to buy or reserve 830 affordable dwellings.
The seventh measure is the most directly aimed at the off-plan bottleneck. The State will now buy parts of projects rather than whole ones, acting as what the government calls an anchor reservation. By committing at the launch of marketing, it helps projects reach the pre-sale threshold banks require before releasing development finance. Land acquisition ceilings move to a regionalised model with communes grouped into six categories.
Rental Market: Rents and Rental Yields
Rents are now rising faster than prices
The clearest tension in the Luxembourg market has moved from sale prices to rents.
Luxembourg's rent price index:
Advertised apartment rents rose 4.4% in the year to Q1 2026 and 0.5% over the quarter, well ahead of both consumer price inflation of 1.6% and the 1.7% rise in the aggregate house price index. In real terms, advertised apartment rents gained about 2.8%. Furnished room rentals, roughly 18% of total rental supply, rose faster still at 4.7%. Advertised house rents were far more subdued at 0.7% over twelve months, though the Observatoire cautions that houses account for only about 13% of rental listings and the indicator is volatile.
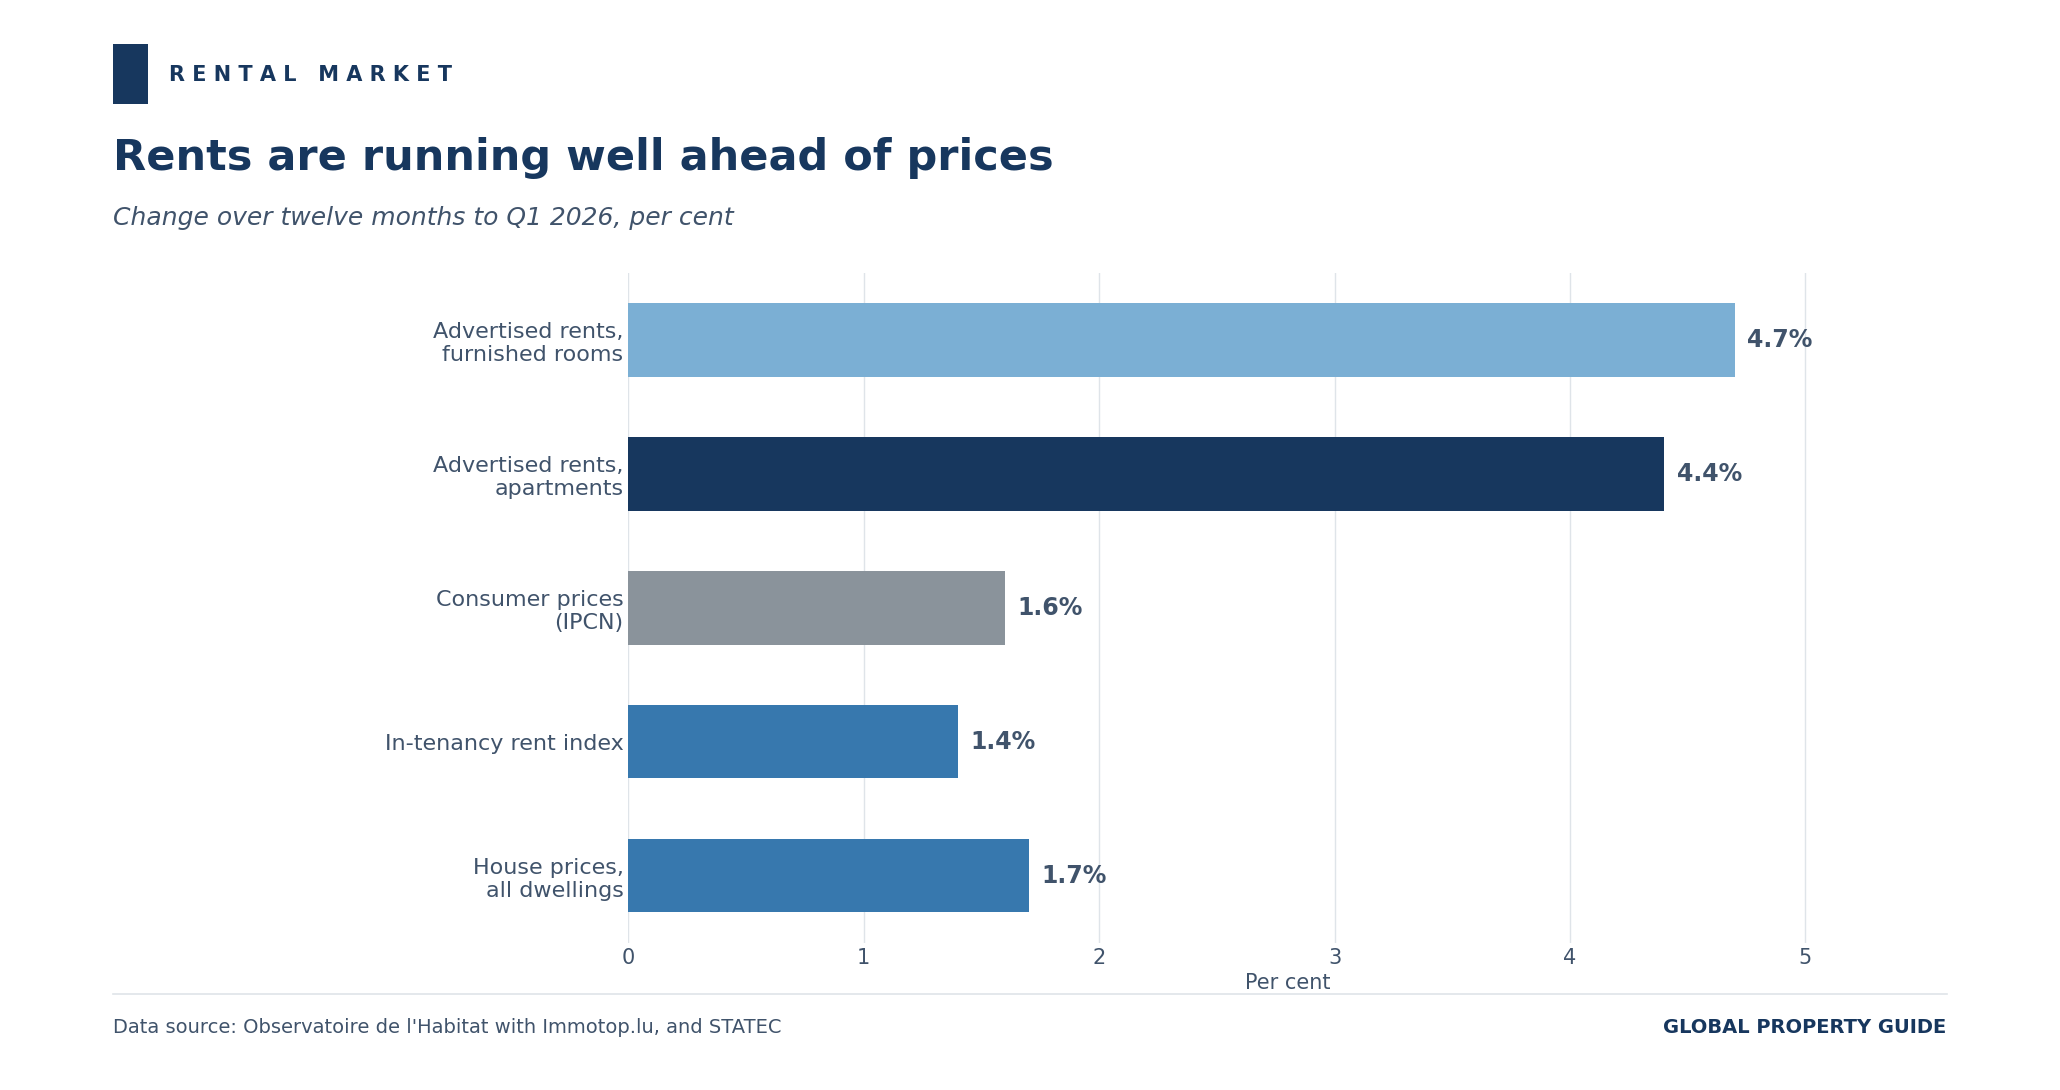
The distinction between asking rents and rents actually being paid matters. STATEC's in-tenancy rent index rose only 1.4% over the same period, slightly below inflation. Sitting tenants are largely protected; new entrants are not.
An Observatoire de l'Habitat study drawing on the rental cadastre put numbers to that gap. Nationally, in-tenancy rents average a little above EUR 20 per square metre a month, and above EUR 25 in Luxembourg City. Apartments make up 86% of the dwellings observed, and 55.3% of rents fall between EUR 1,000 and EUR 1,750 a month, with 16.4% above EUR 2,000.
The median rent for leases signed in 2020 to 2023 was EUR 21.23 (US$24.61) per square metre. For leases signed in 2024 or 2025, it was EUR 24.44 (US$28.33), 15.1% higher. The study puts the cumulative increase at around 70% over fifteen years. Advertised rents sit higher again: Immotop.lu recorded a national average asking rent of EUR 30.72 (US$35.60) per square metre in February 2026, up 7.23% year on year, which is about 26% above the median for recently signed leases.
As elsewhere, smaller units carry the higher rent per square metre. The national median for apartments under 50 square metres is about EUR 30 per square metre, rising to EUR 35 in the capital, while for units above 130 square metres the median halves to about EUR 15.70.
Yields remain low, and slipped back in the latest survey
Rental yields in Luxembourg are low by European standards. Based on Global Property Guide research, gross rental yields on apartments, the return on the purchase price before taxation, vacancy costs and other costs, averaged 3.27% in Q2 2026. That is down from 3.35% in Q4 2025 but still well above the 3.10% recorded in Q2 2025 and the 2.67% of Q2 2024.
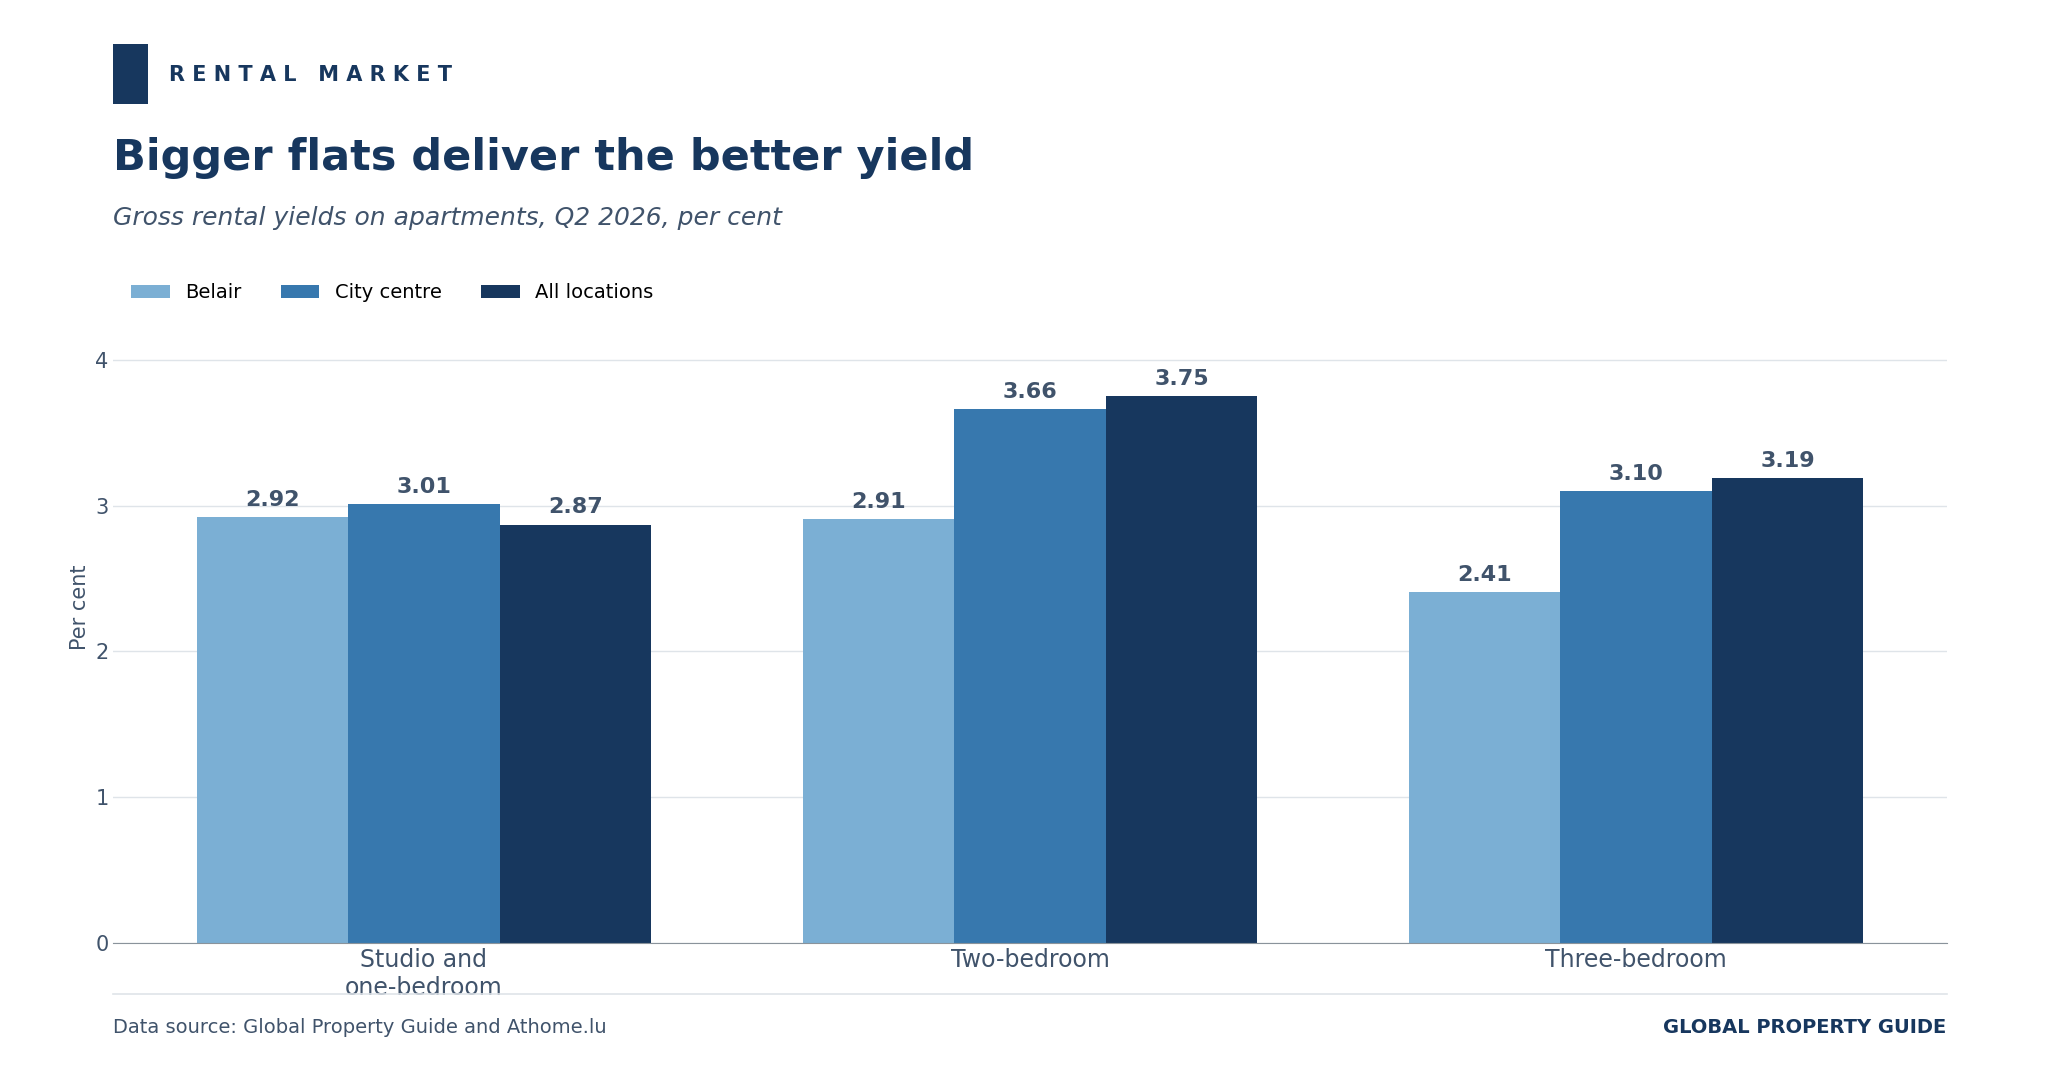
In Q2 2026:
- In Belair, one of Luxembourg City's most exclusive districts, yields ranged from 2.41% on three-bedroom apartments to 2.92% on studios and one-bedroom units.
- In the city centre, yields averaged 3.01% for studios and one-bedroom apartments, 3.66% for two-bedroom apartments and 3.10% for three-bedroom apartments.
- Across all locations, two-bedroom apartments yielded the most at 3.75%, against 3.19% for three-bedroom units and 2.87% for studios and one-bedroom apartments.
Luxembourg City as a whole averaged 3.00%, below the national 3.27%. The pattern has shifted since the prior edition: two-bedroom apartments outside the prime districts now deliver the best return, while the smallest units, once the yield leaders, have fallen behind as their purchase prices held up better than their rents.
Those returns may soon be capped more tightly. Tenants' rights in Luxembourg are already well protected. Most property is rented unfurnished; for furnished property the rent cannot exceed double the previous rate, and rents can be increased only every three years. Annual rent is currently capped at 5% of the invested capital.
A reform under parliamentary discussion would reduce that cap to 3.5%, a 30% cut in the permitted return. Neither the rate nor the timetable is settled. Given that advertised rents in Luxembourg City already exceed EUR 37 per square metre, a 3.5% cap would bind on a far larger share of new lettings than the current 5% does.
Mortgage Market and Interest Rates
The ECB has reversed course
The European Central Bank raised its three key interest rates by 25 basis points on 11 June 2026, the first increase since 2023. The deposit facility moved to 2.25%, the main refinancing operations rate to 2.40% and the marginal lending facility to 2.65%, all effective from 17 June. The Governing Council cited inflation pressure from higher energy prices tied to the conflict in the Middle East.
Luxembourg's mortgage loan interest rates:
The Council held rates at those levels on 23 July 2026, noting in its Economic Bulletin that the full inflationary effect of the energy shock had yet to play out. The deposit rate now stands 25 basis points above its June 2025 trough of 2.00% and 175 basis points below the 4.00% peak of September 2023.
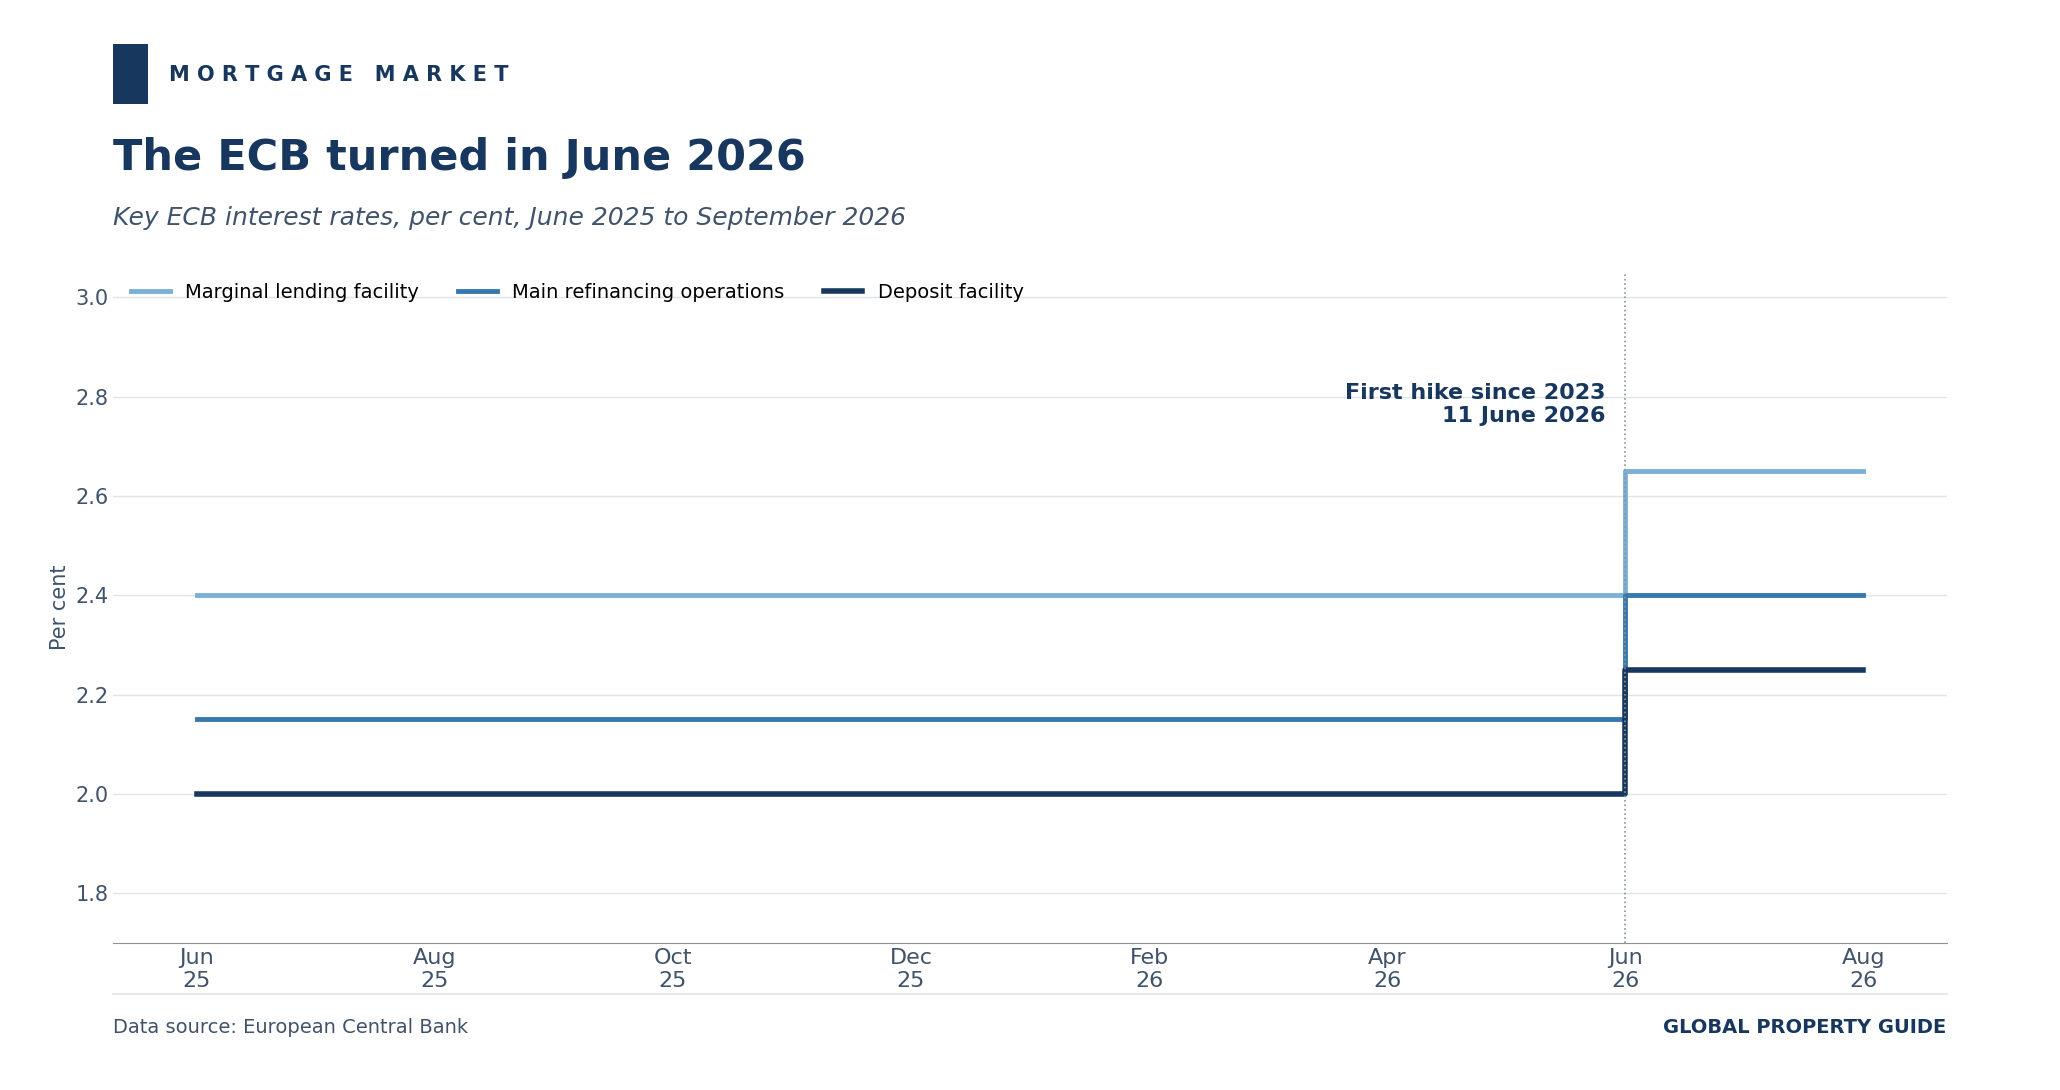
This inverts the backdrop described in the prior edition of this report, which was written when the ECB had cut eight consecutive times, and Luxembourg mortgage rates were falling.
Rates on new residential loans to households turned before the ECB did. The average variable rate reached 3.19% in June 2026, up 9 basis points on May, according to the Banque centrale du Luxembourg.
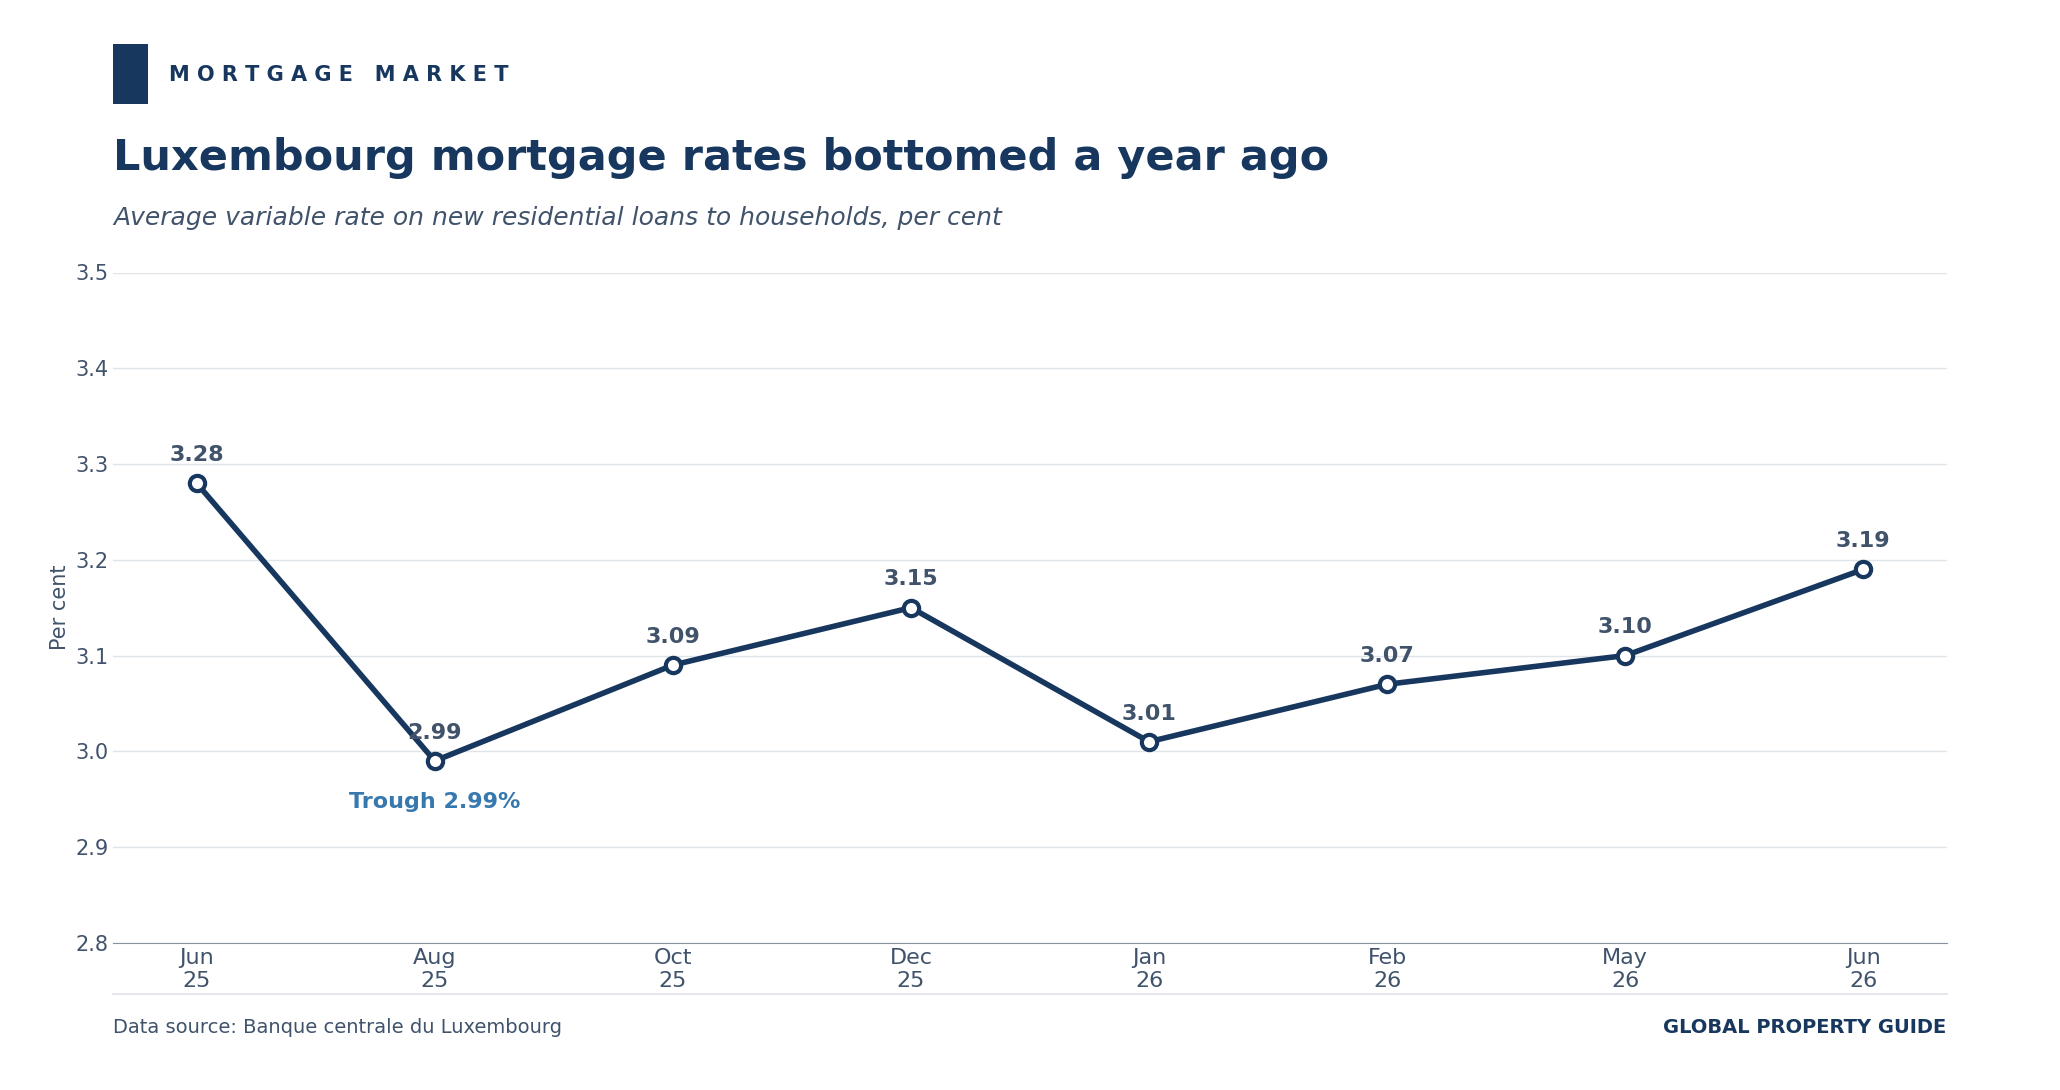
The series troughed at 2.99% in August 2025 and has been grinding higher since, interrupted by a dip to 3.01% in January 2026. June 2026 is 20 basis points above that trough and only 9 basis points below June 2025. The rapid easing of 2024 and early 2025, when the rate fell 154 basis points over twelve months, is over.
Note that the prior edition of this report gave 3.82% as the variable rate for June 2025. The BCL's own release for that month records 3.28%; the fixed-rate figures quoted in that edition match the BCL exactly. The corrected series is used throughout here.
Long fixations now cost the most
By initial rate fixation, in June 2026:
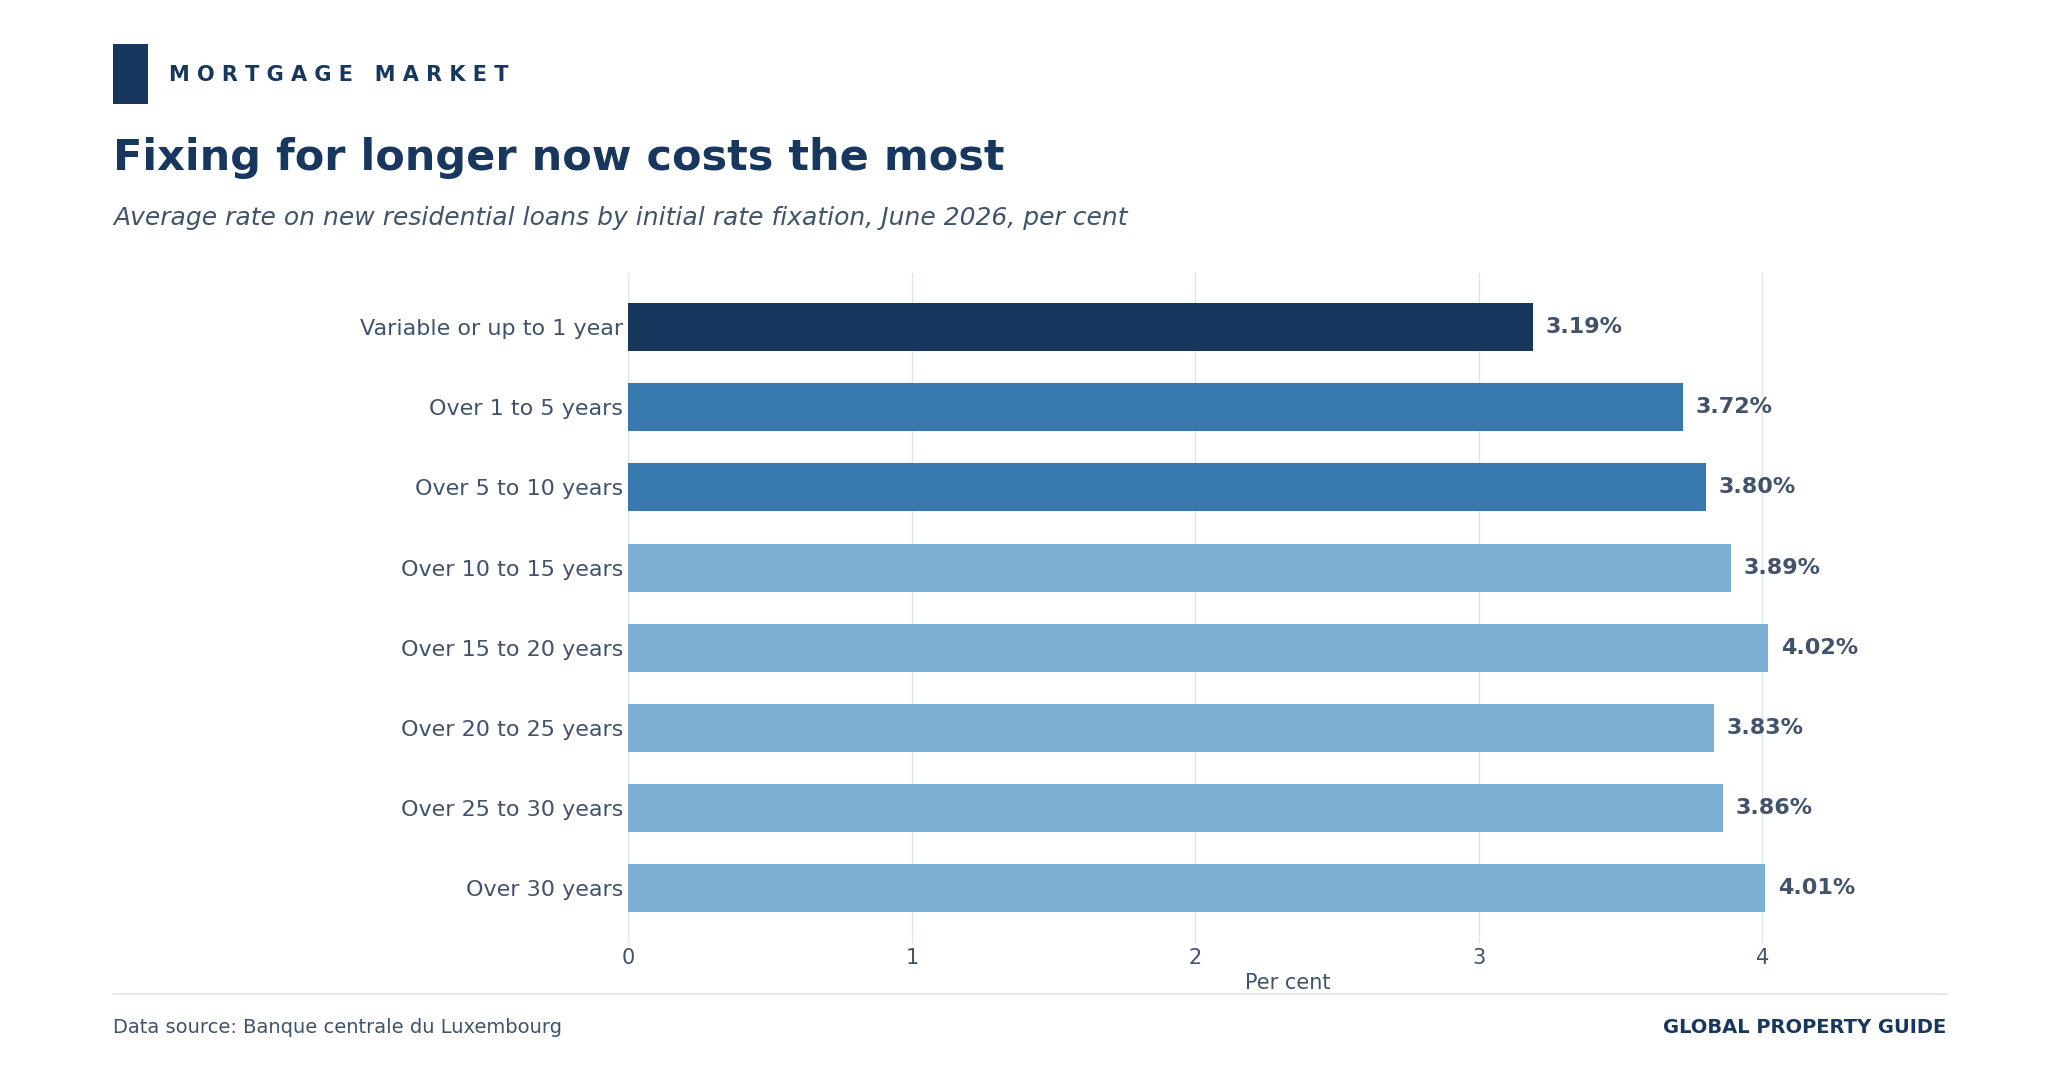
- Variable rate or fixation up to 1 year: 3.19%, up 9 basis points on May and down 9 basis points on a year earlier.
- Over 1 to 5 years: 3.72%, down 2 basis points on May.
- Over 5 to 10 years: 3.80%, down 13 basis points on May.
- Over 10 to 15 years: 3.89%, down 8 basis points.
- Over 15 to 20 years: 4.02%, up 18 basis points and the highest of any bucket.
- Over 20 to 25 years: 3.83%, up 25 basis points.
- Over 25 to 30 years: 3.86%, down 13 basis points.
- Over 30 years: 4.01%, up 13 basis points.
The spread between the variable rate and the 15 to 20 year fixation is 83 basis points. Borrowers who want certainty are paying substantially for it, and the 20 to 25 year bucket alone has risen 32 basis points since October 2025. The BCL cautions that these are weighted averages drawn from a sample of banks, and the thinner buckets move sharply from month to month.
Most loans in Luxembourg carry variable rates, which leaves borrowers directly exposed to further ECB moves. Under the macroprudential framework set by the CSSF on the recommendation of the Comité du Risque Systémique, first-time buyers of a principal residence may borrow up to 100% of the purchase price excluding costs, other principal-residence buyers up to 90%, and buy-to-let investors up to 80%.
Volume tells a harder story than price. Summing the BCL's published figures across every initial rate fixation bucket, new residential lending to households totalled EUR 567 million (US$657 million) in June 2026, against EUR 931 million (US$1,079 million) in June 2025.
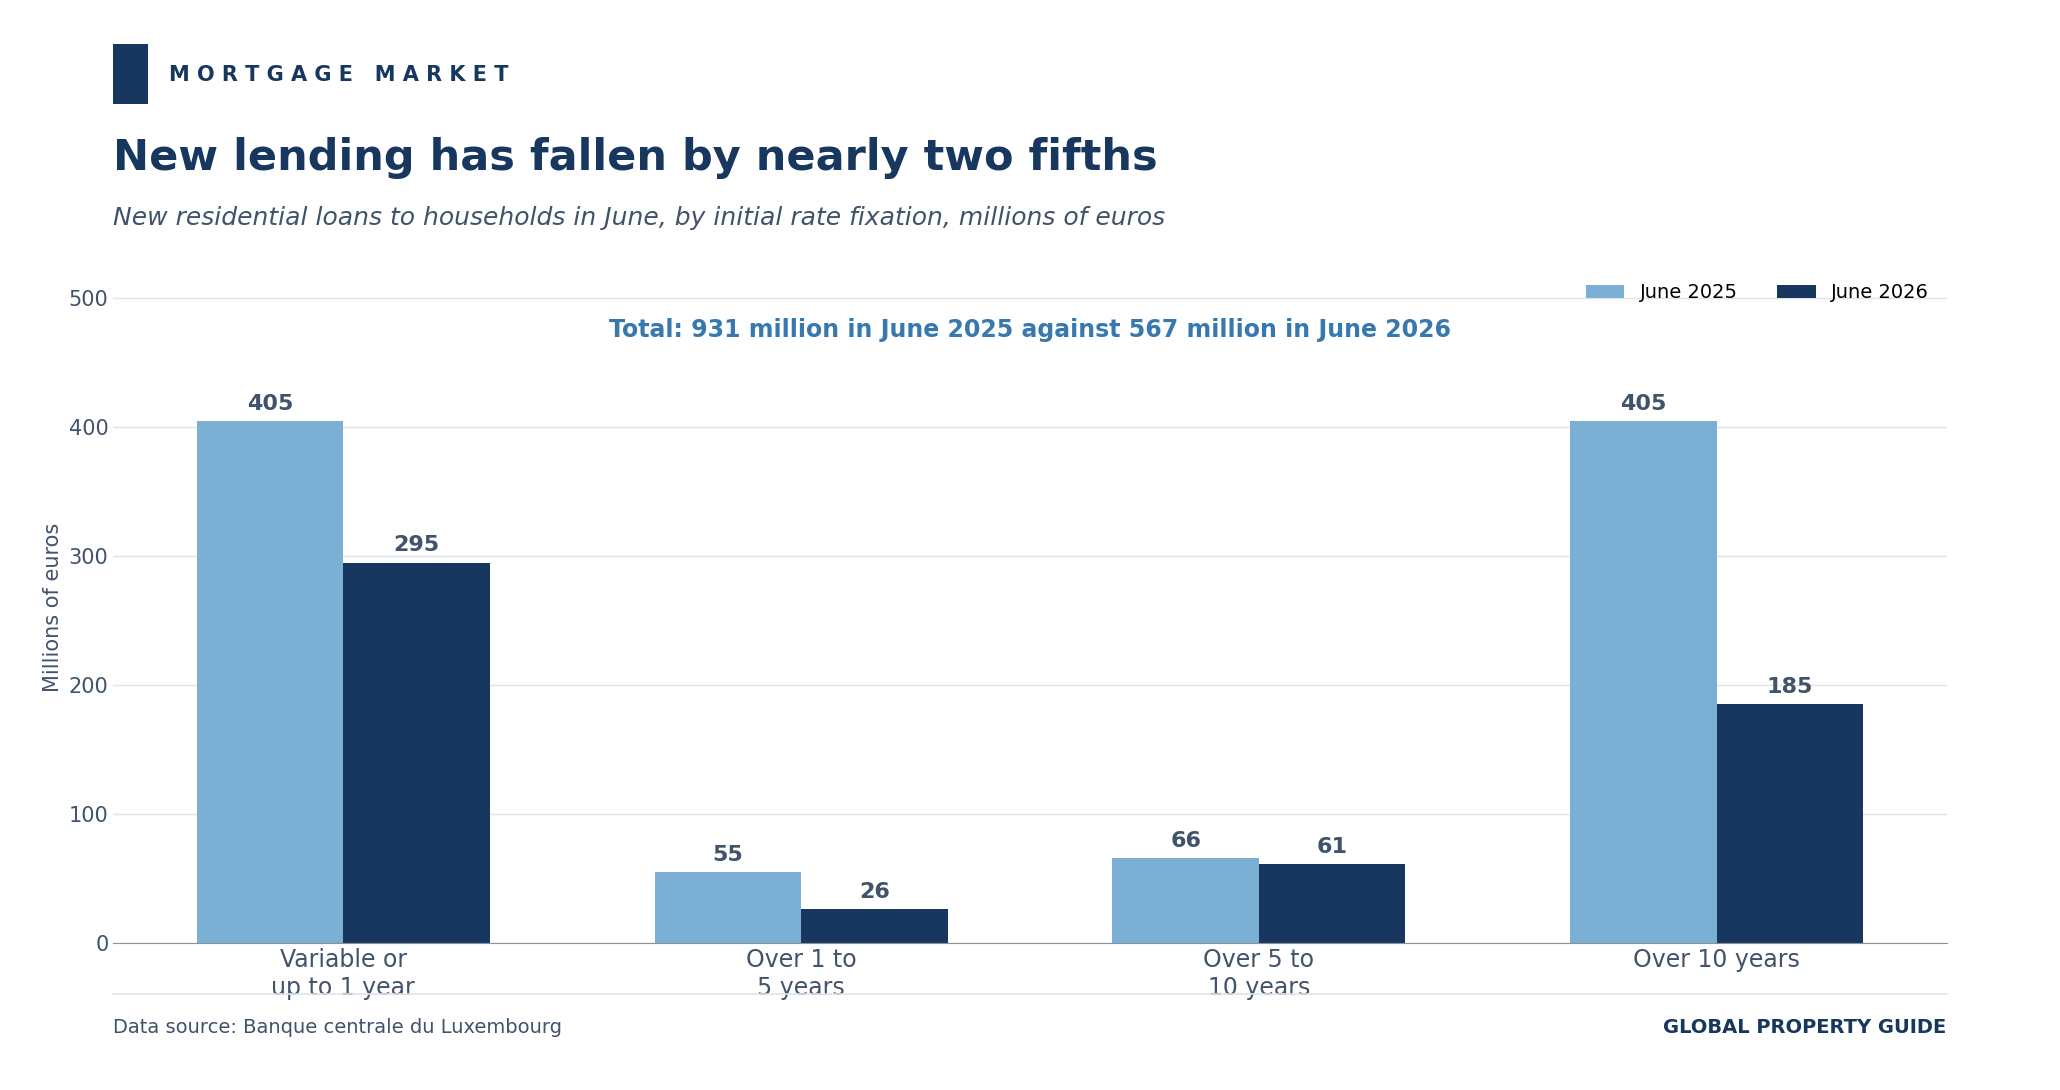
That is a fall of 39.1% year on year. The decline is concentrated in long fixations, where monthly volume dropped from EUR 405 million to EUR 185 million. Variable-rate lending fell from EUR 405 million to EUR 295 million, though June was itself a strong month, up EUR 83 million on May's EUR 212 million.
The stock of outstanding residential loans to households reached about EUR 43.2 billion (US$50.1 billion) at the end of June 2026, an increase of EUR 830 million or 1.96% over twelve months, according to the BCL.
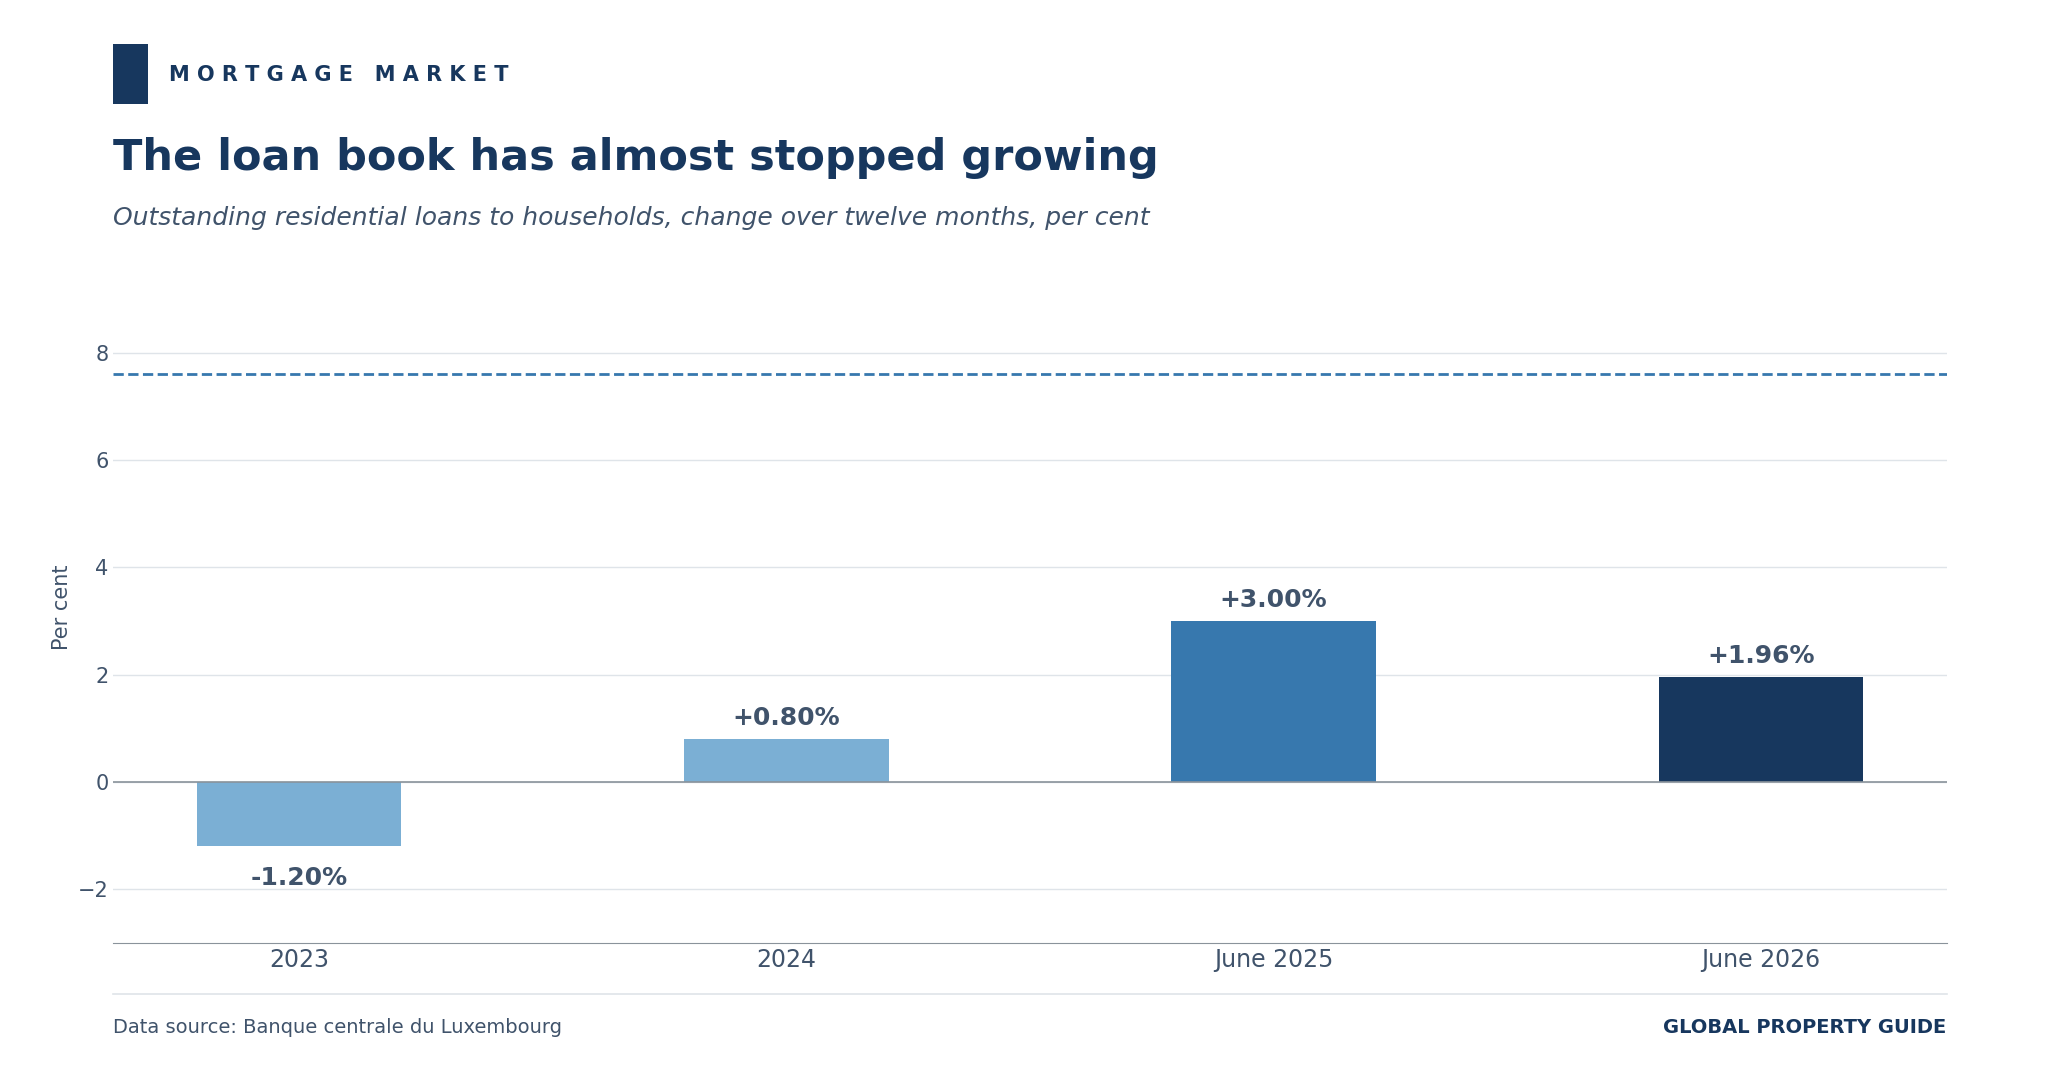
Growth has decelerated from 3.0% in the year to June 2025, and remains far below the annual average of 7.6% recorded between 2008 and 2022 and 14.2% between 2001 and 2007. Within the same bank balance sheets, lending to non-financial corporations fell 2.40% over the year while lending to other financial intermediaries rose 17%. Mortgage credit is not where the growth is.
Historic Perspective
A correction, then four years of drift
Luxembourg house prices compounded at an average of 4.6% a year between Q1 2010 and Q1 2026, one of the steepest sustained runs in western Europe. That run ended in mid-2022.
According to STATEC's hedonic indices, prices fell an average of 16.3% between Q3 2022 and Q1 2024, returning to their Q4 2020 level. Existing apartments fell 15.9% over a slightly later window. The correction was broad: existing apartment prices declined across essentially the whole territory.
2025 was distorted by tax deadlines
The recovery since has been anything but smooth, and 2025 in particular was shaped by policy rather than fundamentals. Temporary housing tax measures were announced with an expiry date, and buyers and sellers moved to beat it.
The aggregate index rose 4.4% in Q2 2025 as activity spiked, fell 3.5% in Q3 as it unwound, then edged up 0.4% in Q4. Compounded, those three quarters delivered barely 1.15%. Over the full twelve months to Q4 2025, the index was essentially flat at 0.1%. Apartment transactions collapsed 34% year on year in Q4 2025, to 1,145 units, with off-plan sales down to 149.
That is what makes the Q1 2026 data useful. It is the first quarter in some time not distorted by an approaching or receding tax deadline, and it shows a market growing at close to the rate of inflation, with volumes normalising on the second-hand side and stuck on the new-build side. The Observatoire describes it as a market once again guided by its economic fundamentals.
Whether that holds is now partly a question of policy again, since the July 2026 measures reintroduce exactly the kind of deadline-driven incentive that distorted 2025. The off-plan duty exemption runs for three years from 16 July 2026.
Economic and Social Factors
Growth is recovering, slowly
Luxembourg's economy grew 0.6% in 2025, an improvement on 0.4% in 2024 but still far below its long-run average. In Q1 2026, real GDP was flat against the previous quarter and up 1.6% year on year, according to STATEC. STATEC revised the recent quarterly path when it published those figures, putting Q4 2025 at 2.1%, Q3 2025 at 3.2% and Q2 2025 at minus 0.5% year on year.
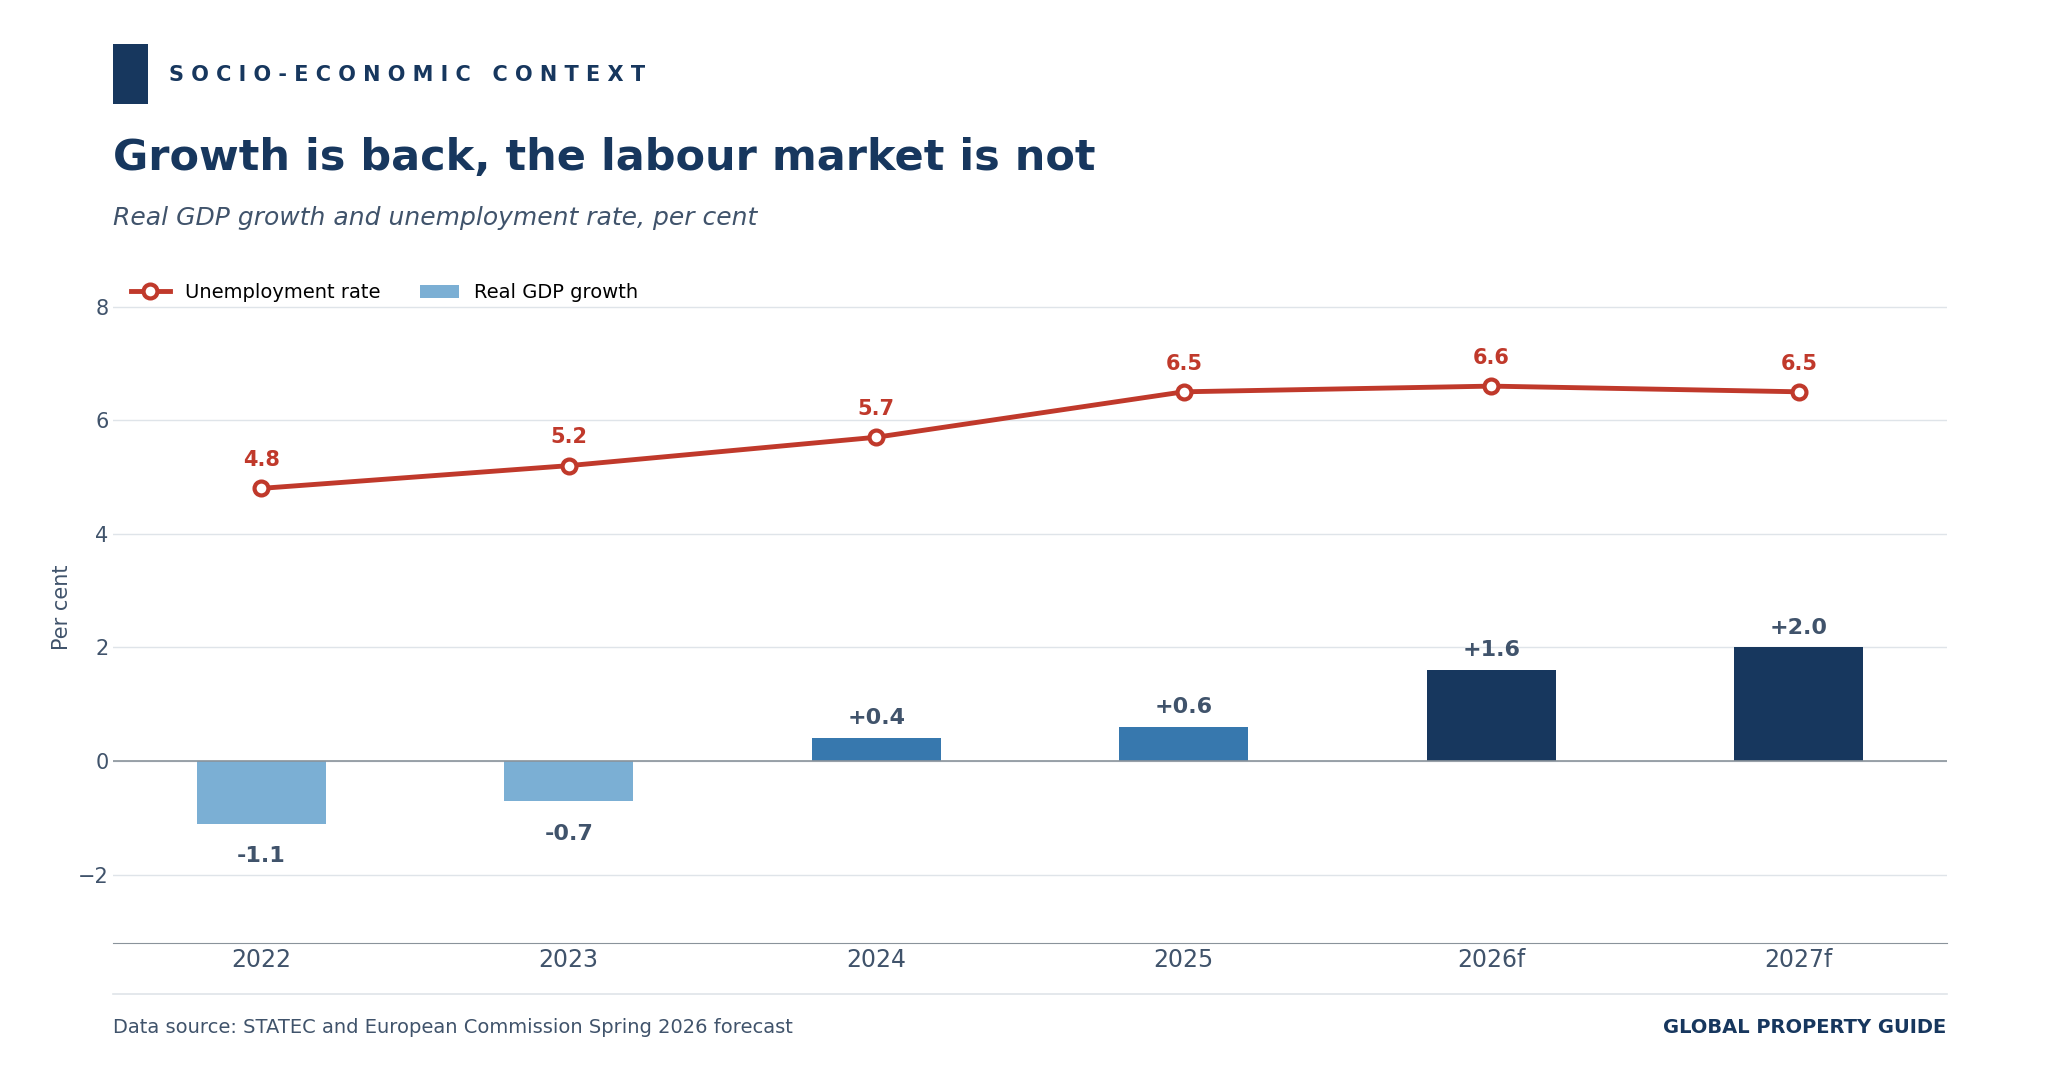
The European Commission forecasts growth of 1.6% in 2026 and 2.0% in 2027, supported by exports of financial services. It notes that construction sector confidence has improved over the past twelve months and expects housing investment to recover slightly in 2026, though a base effect from a 2025 satellite purchase will drag on measured investment growth.
Luxembourg remains among the richest countries in the world on a per capita basis, and its population passed 690,959 in the most recent count.
The labour market has not kept pace with the recovery in output. The unemployment rate stood at 6.3% in July 2026. ADEM recorded 19,943 registered resident jobseekers available for work at 31 July 2026, up 1,547 people or 8.4% year on year. That is a materially worse picture than the 5.9% and 17,886 jobseekers reported a year earlier in the prior edition of this report.
The Commission expects unemployment to hold at 6.6% in 2026 before easing to 6.5% in 2027, with employment growth of 1.3% this year, well below the country's historic average.
Inflation and the public finances have turned
Annual inflation was 2.2% in July 2026, unchanged from June and marginally below the 2.3% of May. The Commission forecasts 2.7% for 2026 as a whole, up from 2.5% in 2025, as energy prices rise following the Middle East conflict, with a wage indexation expected in May 2026 adding to services prices. It projects a deceleration to 1.8% in 2027.
The most significant change in the fiscal picture is the swing in the general government balance, from a surplus of 0.9% of GDP in 2024 to a deficit of 2.0% in 2025, a movement of 2.9 percentage points.
The Commission attributes the deterioration to a revenue shortfall and heavy investment spending. Revenues fell 0.6 percentage points of GDP to 47.1%, reflecting the upward adjustment of personal income tax brackets, a cut in the nominal corporate tax rate from 17% to 16% and the extension of construction sector support measures. Spending rose 2.3 percentage points to 49.1% of GDP, driven by the public sector wage agreement, higher social transfers and public investment, which reached 5.0% of GDP.
A smaller deficit of 1.2% of GDP is projected for 2026, helped by an increase in the social contribution rate from 24% to 25.5%, before widening again to 1.5% in 2027. Gross public debt is forecast to rise from 26.5% of GDP in 2025 to 29.2% in 2026 and 30.2% in 2027. Luxembourg's debt burden remains among the lowest in the European Union, which is what gives the July 2026 housing package its fiscal room.
Sources:
- Le marché immobilier résidentiel au 1er trimestre 2026, Rapport d'analyse no. 25 (Observatoire de l'Habitat): https://gouvernement.lu/
- Le marché immobilier résidentiel au 1er trimestre 2026 (Le gouvernement luxembourgeois): https://gouvernement.lu/
- Booster fir de Wunnengsbau (Le gouvernement luxembourgeois): https://gouvernement.lu/
- Le Logement en Chiffres no. 19 (Ministère du Logement et de l'Aménagement du territoire): https://logement.public.lu/
- Prix de vente (Observatoire de l'Habitat): https://logement.public.lu/
- Loyers annoncés par commune (Observatoire de l'Habitat): https://logement.public.lu/
- Taux d'intérêt, juin 2026 (Banque centrale du Luxembourg): https://www.bcl.lu/
- Taux d'intérêt, juin 2025 (Banque centrale du Luxembourg): https://www.bcl.lu/
- Évolution de la somme des bilans des établissements de crédit (Banque centrale du Luxembourg): https://www.bcl.lu/
- Marchés de capitaux et taux d'intérêt (Banque centrale du Luxembourg): https://www.bcl.lu/
- Monetary policy decisions, 11 June 2026 (European Central Bank): https://www.ecb.europa.eu/
- Economic Bulletin Issue 5, 2026 (European Central Bank): https://www.ecb.europa.eu/
- Economic forecast for Luxembourg (European Commission): https://economy-finance.ec.europa.eu/
- Statistics Portal (STATEC Luxembourg): https://statistiques.public.lu/
- STATEC Estimates Luxembourg GDP Growth at 0% for 1st Quarter of 2026 (Chronicle.lu): https://www.chronicle.lu/
- Crise du logement au Luxembourg, les permis de construire continuent de chuter (Les Frontaliers): https://www.lesfrontaliers.lu/
- Un loyer à Luxembourg-Ville, c'est plus de 25 euros par mètre carré (L'essentiel): https://www.lessentiel.lu/
- Prix de l'immobilier au Luxembourg (B-Immobilier): https://www.b-immobilier.lu/
- Gross rental yields in Luxembourg (Global Property Guide): https://www.globalpropertyguide.com/
- Luxembourg Home Ownership Rate (Trading Economics): https://tradingeconomics.com/