Modest house price rises in Lithuania
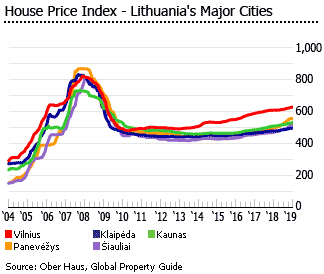
Lithuania’s housing market remains healthy, with the five major cities’ apartment price index (covering Vilnius, Kaunas, Klaipėda, Šiauliai and Panevėžys) rising by 3.99% during the year to January 2019, according to OberHaus Real Estate Advisors. When adjusted for inflation, apartment prices increased 2.21% y-o-y in January 2019.
In Q3 2018, the total number of residential property transactions was at its highest level in over a decade, according to OberHaus. However house prices are still well below pre-crisis levels.
All Lithuanian major cities saw strong to modest house price rises during the year to January 2019:
- In Vilnius average apartment prices rose by 3.2% y-o-y in January 2019, to €1,515 per square metre (sq. m.). When adjusted for inflation, prices in the capital city increased 1.38% over the same period.
- In Kaunas, apartment prices rose by 4.3%, to an average of €1,077 per sq. m. (increased 2.51% after inflation)
- In Klaipėda, apartment prices rose by 3.5%, to an average of €1,075 per sq. m. (increased 1.8% after inflation)
- In Šiauliai, apartment prices rose strongly by 8.5%, to an average of €667 per sq. m. (increased 6.6% after inflation)
- In Panevėžys, existing flats soared by 11.3%, to an average of €645 per sq. m. (increased 9.4% after inflation)
The number of houses sold rose by 3% y-o-y in Q3 2018, while apartment sales increased 4%, according to the State Enterprise Centre of Registers.
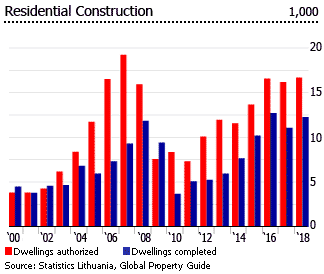
Residential construction activity is also rising. In 2018, dwelling permits rose by 3.1% y-o-y to 16,658 units while dwelling completions increased 10.9% to 12,244 units, according to Statistics Lithuania.
Almost all Lithuanian dwelling stock is in private ownership (98%).
There are virtually no restrictions in foreign ownership of land in Lithuania, except for agricultural lands.
Lithuania’s economy grew by a healthy 3.6% in 2018, after expanding by 3.9% in 2017 and 2.3% in 2016, according to Statistics Lithuania. However, the economy is expected to slow this year, with projected GDP growth rate of 2.8%, amidst weaker external demand, uncertainty surrounding the Brexit and international trade constraints, according to the central bank.
Lithuania joined the eurozone in January 1, 2015.
That crazy housing boom and bust
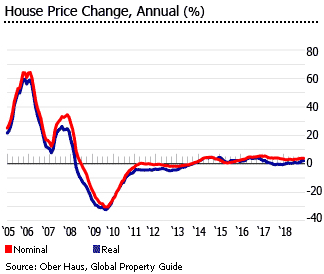
Before the global crisis, Lithuania saw enormous house price increases. The average price of old apartments in Central Vilnius rose 275% between 2002 and 2006. This included a house price surge of 28% in 2003, 29% in 2004, 45% in 2005 and 56% in 2006.
Residential property prices in the capital started to decline in 2008, after the global credit crunch. House prices plunged by 15.23% (-21.85% inflation-adjusted) in 2008 and by another 26.84% (-27.77% inflation-adjusted) in 2009. Then the housing market showed some signs of improvement, with prices falling by just an average of 1.76% (4.94% inflation-adjusted) annually from 2010 to 2012.
In 2013, the property market finally recovered with house prices rising by 1.12 (0.76% inflation-adjusted) from a year earlier. House prices have been rising modestly since then. From 2014 to 2018, house prices increased by 16.18% (7.97% inflation-adjusted).
- In 2014, house prices rose modestly by 3.34% (3.61% inflation-adjusted)
- In 2015, house prices rose by 2.29% (2.38% inflation-adjusted)
- In 2016, house prices rose by 5.5% (3.72% inflation-adjusted)
- In 2017, house prices rose by 3.57% (-0.33% inflation-adjusted)
- In 2018, house prices rose by 3.94% (2.01% inflation-adjusted).
HOUSE PRICE INDEX, 5 LARGEST CITIES |
||
| Year | Nominal | Inflation-adjusted |
| 2008 | -15.23 | -21.85 |
| 2009 | -26.84 | -27.77 |
| 2010 | -2.98 | -6.55 |
| 2011 | -0.64 | -3.91 |
| 2012 | -1.65 | -4.36 |
| 2013 | 1.12 | 0.76 |
| 2014 | 3.34 | 3.61 |
| 2015 | 2.29 | 2.38 |
| 2016 | 5.50 | 3.72 |
| 2017 | 3.57 | -0.33 |
| 2018 | 3.94 | 2.01 |
| Sources: OberHaus, Global Property Guide | ||
Property demand continues to rise
In 2017, transactions rose by 3% y-o-y to 124,600 units, based on figures from the State Enterprise Centre of Registers.
In Q3 2018:
- Houses: about 3,000 units were sold, up 3% from a year earlier
- Apartments: almost 9,000 units were sold, up 4% from a year earlier
Lithuania’s five major cities (Vilnius, Kaunas, Klaipėda, Šiauliai and Panevėžys) account for about one-third of all real estate deals in the country.
In Vilnius, the number of newly constructed apartments sold (or reserved) surged 48% to 1,195 units in Q3 2018 from a year earlier, according to OberHaus.
In Kaunas, sales of newly constructed apartments also rose strongly by 19% y-o-y to 191 units in Q3 2018. On the other hand, Klaipėda saw a more modest growth in new apartments sold of just 3% to 101 units over the same period.
Residential construction activity rising
During the 1980s, when the country was still socialist, more than 20,000 dwelling units were built annually.
Completions dropped to less than 5,000 annually between 1998 and 2003, leaving a huge, pent-up demand.
As the economy gathered steam, housing construction accelerated:
- In 2004-2006 dwellings completions rose to an average of 6,700 yearly
- In 2007, there were 9,286 completed dwellings
- In 2008 dwelling completions rose to 11,286, the highest since 1992
Then suddenly things stalled. Completions averaged just 5,500 units annually from 2010 to 2014.
Construction activity started to recover in 2015. Dwelling completions soared 24.8% y-o-y to 12,703 units in 2016, the highest level since Communism. In 2017, there were more than 11,000 dwelling completions, down 13.1% from a year earlier but still one of the highest levels ever recorded.
In 2018:
- The number of dwellings for which building permits were granted rose by 3.1% y-o-y to 16,658 units, based on figures from Statistics Lithuania.
- Dwelling completions rose by 10.9% y-o-y to 12,244 units.
Mortgage market continues to recover
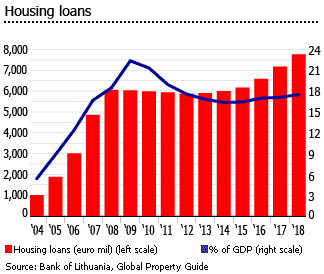
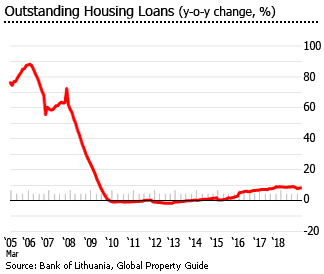
About 80% of all dwelling purchases are now made with the aid of mortgages, and typically 95% of all property value is granted in loans. The mortgage market reached 17.54% of GDP in 2018, almost back to the 22.4% of GDP it occupied before the 2009 crisis, and up from a mere 0.4% of GDP in 2000.
Interest rates rising gradually
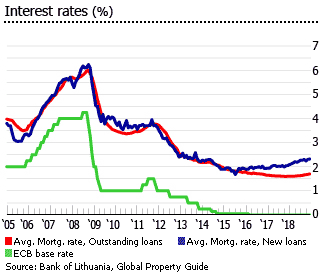
More than 99% of all loans have initial rate fixation of over 5 years. All new loans are in euros. Lithuania joined the Euro on January 1, 2015, the bloc’s 19th member. The Litas, which had been pegged to the Euro for a decade, went out of circulation.
New loans:
- The average interest rate for new housing loans with initial rate fixation (IRF) of up to 1 year stood at 2.28% in December 2018, up from 1.96% a year earlier and 1.8% two years ago, according to the Bank of Lithuania.
- The average rate for new housing loans with IRF of more than 1 year was 5.03%, up from 4.57% in December 2017 and just 2.78% in December 2016.
The average interest rate for outstanding housing loans was 1.7% in December 2018, slightly up from 1.61% a year earlier and 1.65% two years ago.
Rents continue to rise; rental yields remain good
Gross rental yields - the average return on investment - on apartments both in the city centre and in the suburbs are moderately good, at around 5%. In Vilnius, rental yields have been almost stable in the past three years, according to Global Property Guide research conducted in October 2018.
During the year to Q3 2018, average rents in Vilnius increased by a modest 3%, while Klaipėda and Kaunas saw higher rent rises of 7% and 5%, respectively, according to OberHaus.
Rents in the centre are around €9-10 per sq. m. per month, while in the suburbs rents are around €7-8 per sq. m. per month.
A 120 sq. m. apartment in the centre could be rented out for around €1,100 per month while in the suburbs, a 120 sq. m. apartment fetches around €850 per month.
Moderate economic growth
In 2018, Lithuania’s economy expanded by a healthy 3.6%, according to Statistics Lithuania, after growing by 3.9% in 2017 and 2.3% in 2016.
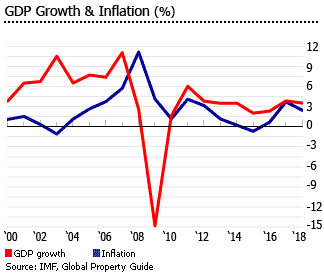
However, the economy is expected to slow this year, with projected GDP growth rate of 2.8%, according to the central bank.
“The growth will be slowed down by weaker external demand. Uncertainty about Brexit, international trade constraints and slower than current growth of the main Lithuania’s trade partners are among the main risk factors as regards economy growth this year,” said Darius Imbrasas, senior economist at the Bank of Lithuania.
The financial crisis of 2008-9 brought to an end years of amazing average growth of 8.2% from 2001 to 2007. The economy slowed in 2008, and shrank by almost 15% in 2009.
In 2010 the economy finally emerged from recession, with GDP growth of 1.6%. Then in 2011 the Lithuanian economy began to expand strongly, with real GDP growth of 6.1%, the second fastest pace in the EU. The economy expanded by an average of 3.6% annually from 2012 to 2014. However in 2015, economic growth slowed to 2%, the slowest growth since 2010, due to sluggish investment and decline in exports to Russia, the country’s largest single trading partner.
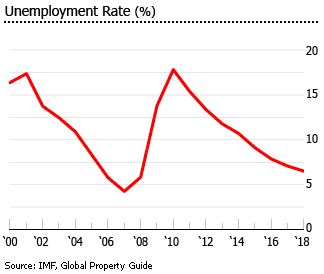
Unemployment was 6% in Q4 2018, down from 6.7% in the same period last year, according to Statistics Lithuania.
Inflation is expected to slow to 2.2% this year, down from 2.5% in 2018 and 3.7% in 2017, according to the European Commission.
Lithuania’s public finances at sustainable levels
In 2018, Lithuania recorded a budget surplus of about 0.6% of GDP, up from surpluses of 0.5% in 2017 and o.3% in 2016 and deficits of 0.2% in 2015, 0.6% in 2014 and 2.6% in 2013.
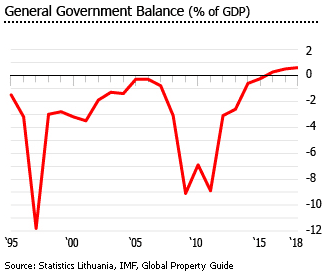
During the global crisis, the deficit ballooned to 9.4% of GDP in 2009, and remained high in 2010 at 7.2% of GDP, and 8.9% in 2011. Then in 2012, Lithuania adopted a budget that would narrow the public sector deficit to 3.1% of GDP, in a bid to join the eurozone.
Government debt was equivalent to around 37% of GDP in 2018, down from 39.7% in 2017, 40.1% in 2016, 42.6% in 2015 and 40.5% in 2014, and well below the 60% threshold.
Sources:
- MFI interest rate statistics (Bank of Lithuania): https://www.lb.lt/en/mfi-interest-rate-statistics-1
- Loans to residents (Bank of Lithuania): https://www.lb.lt/en/loans-to-residents-1
- Economic forecast for Lithuania (European Commission): https://ec.europa.eu/info/business-economy-euro/economic-performance-and-forecasts/economic-performance-country/lithuania/economic-forecast-lithuania_en
- Lithuania Inflation January 2019 (Focus Economics): https://www.focus-economics.com/countries/lithuania/news/inflation/inflation-dips-to-over-two-year-low-in-january
- Prices are rising in Vilnius; rental yields are moderately good at around 5% (Global Property Guide): https://www.globalpropertyguide.com/Europe/Lithuania/Rental-Yields
- World Economic Outlook Database October
- 2018 (International Monetary Fund):
- https://www.imf.org/external/pubs/ft/weo/2018/02/weodata/index.aspx
- Ober-Haus Lithuanian apartment price index (OHBI) (OberHaus): https://www.ober-haus.lt/wp-content/uploads/OHBI-January-2019.pdf
- Apartment prices in Kaunas overtake Klaipeda after more than 6 years (OberHaus): https://www.ober-haus.lt/en/apartment-prices-kaunas-overtake-klaipeda-6-years/
- Residential real estate market commentary (OberHaus): https://www.ober-haus.lt/wp-content/uploads/OH-Lithuania-Residential-Q3-2018.pdf
- Lithuania’s GDP expanded by 3.6 percent in 2018, to slow down this year (Xinhua News): http://www.xinhuanet.com/english/2019-01/30/c_137787669.htm