Finland: house prices up in Helsinki, but rest of the country slows
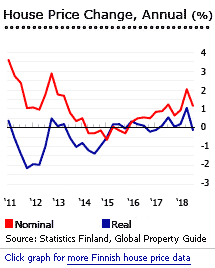 House prices in Helsinki continue to rise, amidst low interest rates and improving economic conditions.
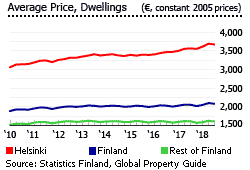
The average price of old dwellings in Greater Helsinki increased by 2.95% (1.63% inflation-adjusted) to €3,666 (US$ 4,179) per square metre (sq. m.) during the year to Q3 2018, according to Statistics Finland. The average price of blocks of flats rose by 3.7% to €3,898 (US$ 4,444) per sq. m. The average price of terraced houses rose by 2.32% to €3,310 (US$ 3,774) per sq. m.
However in the rest of the country, the average price of old dwellings fell slightly by 0.31% (-1.58% inflation-adjusted) to €1,612 (US$ 1,838) during the year to Q3 2018. Flats had average prices of €1,611 (US$ 1,837) per sq. m., down by 0.12% y-o-y. Likewise, terrace houses had also a slight price drop of 0.56% y-o-y to an average price of €1,612 (US$ 1,838) per sq. m.
Overall, the average price of old dwellings in Finland rose by a miniscule 1.17% y-o-y (-0.13% inflation-adjusted) to around €2,082 (US$ 2,374) per sq. m. in Q3 2018.
The primary market seems more vibrant but also follows the general trend with new dwelling prices in the whole country rising by 4.08% (2.75% inflation-adjusted) to €3,773 (US$ 4,301) per sq. m. during the year to Q3 2018. New dwelling prices in Helsinki rose strongly by 7.22% (5.85% inflation-adjusted) to €4,962 (US$ 5,657) per sq. m. while they increased by a modest 2.54% (1.23% inflation-adjusted) to €3,354 (US$ 3,824) in the rest of the country.
Demand continues to fall. In the first eleven months of 2018, total transactions of old dwellings fell by 8.2% y-o-y to 53,849 units, after annual declines of 2.4% in 2017 and 0.6% in 2016, according to Statistics Finland. Transactions dropped 8.9% in Greater Helsinki and fell by 8% in the rest of the country.
Residential construction activity is mixed. During the first ten months of 2018, the number of dwelling permits issued for residential buildings fell by 17% from the same period last year, according to Statistics Finland. In contrast, dwelling starts rose by 5.9% and completions were up by 21.4% over the same period.
Finland is expected to continue to see a two-tier housing market this year, with Helsinki and other major cities projected to have healthy house price rises, according to local real estate experts.
The Finnish economy expanded by about 2.7% in 2018, according to the Bank of Finland – the second fastest growth since 2010. The economy is expected to expand by a modest 1.9% this year and by another 1.7% in 2020, according to the central bank.
In 2000 the government removed the requirement that a nonresident must obtain a permit to buy a secondary residential property in Finland, putting foreigners on exactly the same footing as Finns. However, foreigners need permission to buy property in the Province of Aland (Ahvenanmaa), an archipelago.

A history of extreme house price cycles
From 1980 to Q1 2009, the country experienced several dramatic house-price cycles:
The relative volatility of house prices in Finland has 3 main causes:
- the export-oriented economy’s sensitivity to global shocks;
- the housing market’s high interest rate sensitivity. In 1994, about 70% of new mortgages were variable rate. Since 2001, more than 90% of new mortgages have been variable rate, taking advantage of historic low interest rates from 2003 to 2006.
- an insufficiently responsive supply side. Finland’s long housing boom was encouraged by a decade of under-building. Less than 30,000 dwellings were completed annually from 1994 to 1999, down on 40,000 units annually from 1983 to 1991 (with a peak level of 65,397 units in 1990).
| INFLATION-ADJUSTED PRICE CHANGE OF EXISTING DWELLINGS, 1983 - 2017 | |||
| Finland | Helsinki | Rest of Finland | |
| 1983 – 1989 | 64.0% | 68.5% | - |
| 1989 – 1993 | -49.2% | -53.4% | -44.4% |
| 1993 – 1994 | 6.6% | 10.3% | 3.2% |
| 1994 – 1995 | -4.8% | -6.3% | -1.9% |
| 1995 – 1999 | 45.0% | 62.8% | 38.0% |
| 1999 – 2001 | -6.9% | -5.5% | -12.0% |
| 2001 – Q2 2008 | 42.0% | 45.7% | 33.4% |
| Q2 2008 – Q1 2009 | -6.4% | -8.6% | -4.0% |
| 2010 – 2017 | 12.4% | 18.9% | 6.5% |
| Sources: Statistics Finland, Global Property Guide | |||
Finland’s most recent house price boom from 2001 to Q2 2008 was typical. There was strong economic and wage growth, plus a decline in interest rates. The interest rate drop has lead to a surge in housing demand during the period, resulting to strong increase in house prices. From 2001 to Q2 2008, house prices in Finland rose by 42% and by almost 46% in Greater Helsinki.
However, similar to other developed countries, Finland was also adversely affected by the global crisis, which caused house prices to decline by about 6.4% from Q2 2008 to Q1 2009. The housing market bounced back quickly but house price rises have been modest since. From 2010 to 2017, house prices in Greater Helsinki rose by 18.9% and by just 6.5% in the rest of the country.
Residential construction activity mixed
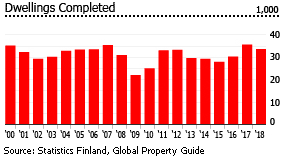
Dwelling permits for residential buildings fell by 17% to 33,659 units during the first ten months of 2018, according to Statistics Finland. Permits for blocks of flats dropped 21.1%, while permits for detached houses fell by 5.3%.
However dwelling starts from January to October 2018 were up 5.9% from the previous year. Dwelling completions soared 21.4% y-o-y from January to October 2018. Blocks of flats completions rose strongly by 28.9% while detached houses completions had a minimal rise of just 1.9%.
Finland’s long housing boom has been encouraged by a decade of under-building. Less than 30,000 dwellings were completed annually from 1994 to 1999, down on 40,000 units annually from 1983 to 1991 (with a peak level of 65,397 units in 1990). From 2000 to 2017, dwelling completions averaged 31,100 units per year.
Currently, there are about 3 million dwellings in Finland.
Property transactions falling
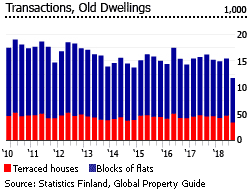
In the first eleven months of 2018, total transactions of old dwellings fell by 8.2% y-o-y to 53,849 units, according to Statistics Finland. Over the same period:
- In Greater Helsinki, transactions for old dwellings fell by 8.9% y-o-y to 15,607 units.
- In the rest of the country, transactions for old dwellings fell by 8% y-o-y to 37,898 units.
By property type:
- For terraced houses, transactions fell by 5.5% y-o-y to 17,320 units in January to November 2018.
- For blocks of flats, transactions fell by 9.5% y-o-y to 36,314 units over the same period.
Interest rates remain very low
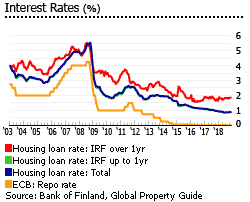
Finland’s new housing loan interest rates are still very low at 0.89% in November 2018, down from 0.97% the previous year and 1.12% two years ago, according to the Bank of Finland.
For new housing loans:
- Up to 1 year initial rate fixation (IRF): 0.87%, down from 0.95% a year earlier and 1.1% two years ago
- Over 1 year IRF: 1.84%, slightly up from 1.75% a year earlier and 1.67% two years ago
For outstanding housing loans, the average interest rate was 0.98% in November 2018, slightly down from 1.02% a year earlier and 1.08% two years ago.
- Up to 1 year maturity: 0.91%, down from 1.07% a year ago and 1.23% two years ago
- 1-5 years maturity: 1.12%, down from 1.24% in the previous year and 1.34% two years ago
- Over 5 years maturity: 0.97%, down from 1.02% a year earlier and 1.07% two years ago
The continued decline in loan rates is mainly attributed to the European Central Bank’s (ECB) reduction of its key rate to a record-low of 0.00% in March 2016, where it has remained since.
Mortgage market slowing
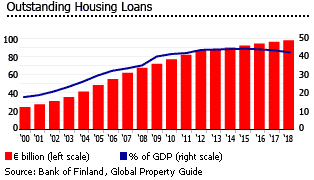
Finland’s mortgage market has enjoyed strong growth during the past two decades, with outstanding mortgage loans rising from 16.2% of GDP in 1995 to 43.9% of GDP in 2015, according to the Bank of Finland. But the size of the mortgage market declined slightly to 42.9% of GDP in 2017 and to 41.9% of GDP in 2018, indicating that the overall economy is growing faster than the mortgage market. From 1998 to 2007, outstanding housing loans experienced double-digit annual expansions averaging around 14%.
Low to moderate rental yields
Rental apartments have low to moderate returns, with gross rental yields in Helsinki ranging from 2.86% to 4.11%, according to a Global Property Guide research.
Smaller apartments in Helsinki ranging from 60 sq. m. to 90 sq. m. have rental yields around 4.03% and 3.68%, respectively. Larger apartments of approximately 120 sq m. to 200 sq. m. have average rental yields of 3.49%.
Rents continue to rise modestly. The average monthly rent in Finland was €13.15 (US$ 14.99) per sq. m. in Q3 2018, up by 1.4% from the previous year, according to Statistics Finland. Private rents rose by 1.6% to €14.24 (US$ 16.23) per sq. m., higher than the 1.1% increase to €11.85 (US$ 13.51) per sq. m. on government-subsidized rents.
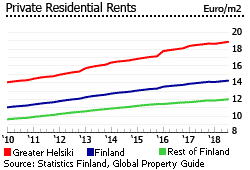
Greater Helsinki rents were up by 1.6% y-o-y to €16.2 (US$ 18.47) per sq. m. in Q3 2018. Private rents were around €18.86 (US$ 21.50) per sq. m., comparably higher than government-subsidized rents, averaging at €13.19 (US$ 15.04) per sq. m. In Q3 2018, average rents of government-subsidized dwellings are 30% lower than private rents in Helsinki, and 16% cheaper in Finland as whole.
Despite the complete deregulation of the private rental market in 1995, private rents are still distorted by the large social housing sector. From 2001 to 2007, house prices in Finland rose by around 50%, while private rental rises trailed with growth of only 17%. In Helsinki, house prices rose 55% while private rents rose by only 12%, leading to the relatively low rental yields.
The Finnish tax system still privileges owner-occupation. Despite reforms during the 1980s, a flat 29% tax deduction on mortgage interest remains in place, while imputed rental income and capital gains on permanent homes are untaxed.
Around 31% of all dwellings in Finland are currently rented. Out of those, 61% are privately rented, while 39% are government-subsidized.
Satisfactory economic growth; falling unemployment
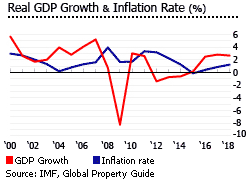
The Finnish economy expanded by about 2.7% in 2018, amidst improving exports, strong private consumption and growing employment, according to the Bank of Finland. It was the second fastest growth since 2010.
The economy is expected to expand by a modest 1.9% this year and by another 1.7% in 2020, based on the central bank forecast.
The eurozone debt crisis dragged Finland’s economy back into recession in 2012, three years after an 8.3% contraction during the 2009 global financial crisis. The economy shrunk by 1.4% in 2012, and the contractions continued in 2013 and 2014, with the economy shrinking by 0.8% and 0.6%, respectively.
In 2015, the economy, although freed from recession, barely grew. During the same year, Finland was named the weakest economy in the euro zone, which prompted the country’s finance minister to label it "the new sick man of Europe".
At the heart of this has been the rise of the Smartphone and the inability of Nokia to compete. Between 1998 and 2007, Nokia was responsible for 20% of all of Finland’s exports, and in 2000 Nokia alone accounted for 4% of the country’s entire GDP. But by 2008-9 the writing was on the wall, and the February 2011 partnership with Windows failed to save the company; by mid-2012 Nokia was almost bankrupt, and its contribution to Finnish GDP was actually negative. In April 2014 Nokia sold its mobile phone business to Microsoft. Nokia’s decline (though it is still the second largest mobile company in the world by sales volumes, but its business is low-end and profitability is low) left over 40,000 highly-skilled Finnish ICT workers unemployed.
The country’s exports were also plagued by the economic recession in Russia, as well as by Finland’s inflexible labor market and high labour costs. In June 2016, a Competitiveness Pact was signed to reduce labour costs. The agreement includes the following conditions, which mostly became effective in 2017:
- A wage freeze for one year;
- An increase of 24 hours in the annual working time (still without raising wages);
- A higher share of social security payments to employees; and
- A reduction of holiday bonuses in the public sector.
The government pledged income tax concessions for participating employers worth approximately around €315 million (US$359 million) to €515 million (US$587 million).
As a result, exports grew faster than imports. The value of goods exports grew by 9% in November 2018 from a year earlier to €5.77 billion (US$6.58 billion) while imports increased by 5%.
Finland’s unemployment rate fell to 6.2% in November 2018, from 7.1% a year earlier, according to Statistics Finland.
Finland’s budget deficit stood at 0.8% of GDP last year, slightly up from 0.7% in 2017. The deficit is expected to fall to 0.2% of GDP this year and to 0.1% of GDP in 2020, according to the European Commission. Finland’s debt-to-GDP ratio is expected to fall slightly to 58.5% this year, from 59.8% in 2018 and 61.3% in 2017.
Inflation stood at 1.2% in December 2018, slightly down from 1.3% in the previous month but up from 0.5% a year earlier, according to Statistics Finland. Inflation is expected to accelerate to 1.6% this year and to 1.8% in 2020, based on estimates from the European Commission.