Ireland’s housing market has lost steam
Ireland's housing market has changed shape. House price growth has slowed for six consecutive months, and selling prices in Dublin have started to fall, while the counties furthest from the capital are still posting near double-digit gains. In the rental sector, the opposite happened: a regulatory overhaul that took effect in March produced the largest quarterly rent increase in more than two decades, then subsided. Behind both stands a monetary policy reversal, with the European Central Bank raising interest rates in June for the first time in almost three years.
This extended overview from Global Property Guide covers key aspects of the Irish housing market and takes a closer look at its most recent developments and long-term trends.
All euro conversions in this report use a single reference pair, EUR 1 = USD 1.1587, the market close on 3 September 2026.
Table of Contents
- Property Prices and Price Index
- Historic Perspective
- Property Demand Trends
- Property Supply Trends
- Rental Market: Rents and Rental Yields
- Mortgage Market and Interest Rates
- Economic and Social Factors
Property Prices and Price Index
According to the Central Statistics Office (CSO), the nationwide Residential Property Price Index rose by 5.6% in the twelve months to June 2026, down from 6.1% in the year to May. The CSO describes this as the slowest annual rise since January 2024. It is the sixth consecutive month of deceleration, from 6.95% in December 2025, the reading carried in the previous edition of this report.
Ireland's house price annual change:
The slowdown is sharper once inflation is taken into account. Consumer prices rose 3.4% in the year to June 2026, against 2.8% in December 2025. Adjusted for inflation, house prices gained 2.13% in the year to June, down from 4.08% six months earlier. Real growth has roughly halved while the nominal figure fell by less than a fifth.
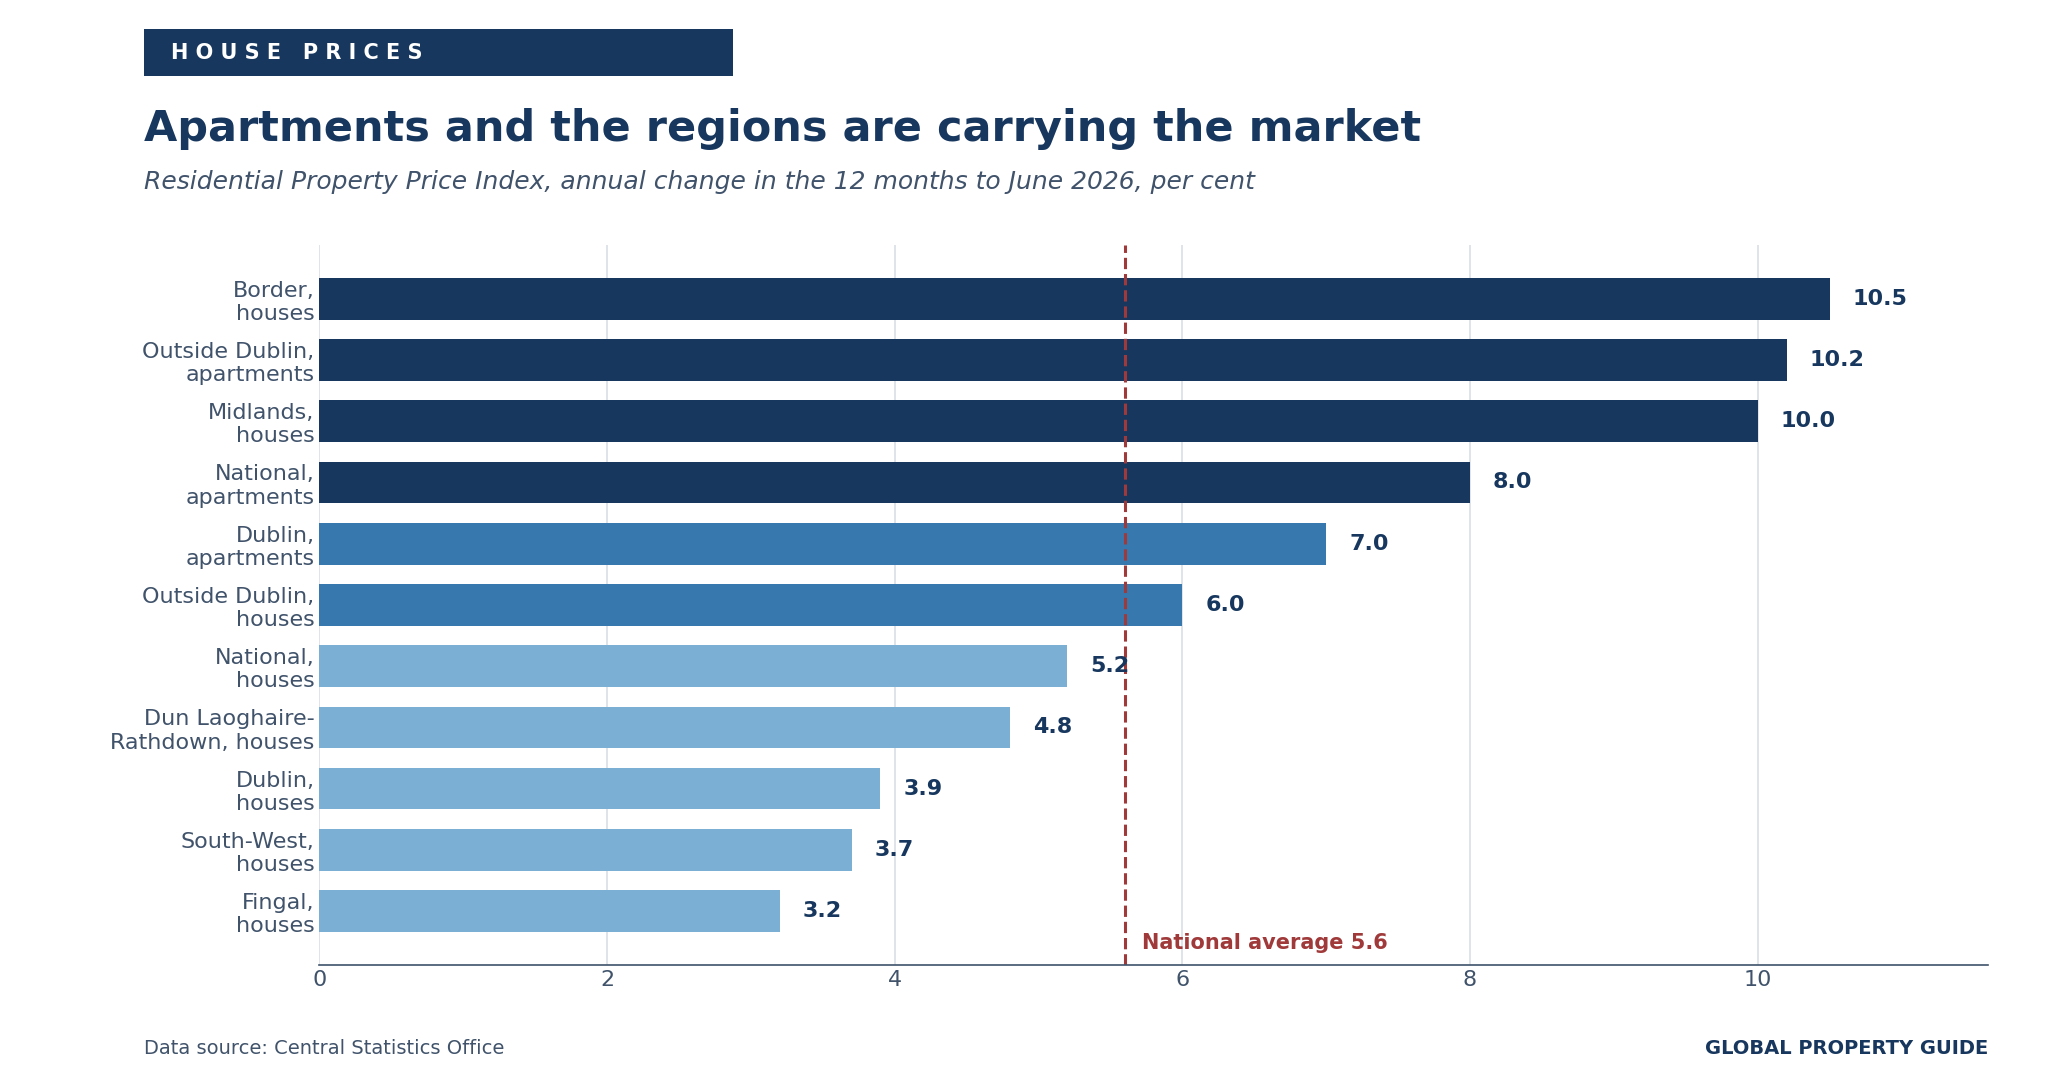
Where the growth is coming from has also shifted. Nationally, apartment prices rose 8.0% against 5.2% for houses. Outside Dublin, the gap is wider still, with apartments up 10.2% and houses up 6.0%. Regionally, the Border counties of Cavan, Donegal, Leitrim, Monaghan and Sligo led on house prices at 10.5%, followed by the Midlands at 10.0%. The South-West, meaning Cork and Kerry, was slowest at 3.7%. Within Dublin, Fingal was the weakest local authority area at 3.2%.
The national index reached 206.9 in June, 26.5% above the April 2007 peak and 182.1% above the early-2013 trough. Households paid a median price of EUR 396,000 (USD 458,845) for a dwelling in the twelve months to June. Dublin had the highest regional median at EUR 500,000 (USD 579,350), rising to EUR 682,334 (USD 790,620) in Dun Laoghaire-Rathdown. Longford was the least expensive county at EUR 198,000 (USD 229,423).
Median dwelling prices by region, 12 months to June 2026:
| Median price (EUR) | Median price (USD) | |
| Dun Laoghaire-Rathdown | EUR 682,334 | USD 790,620 |
| Dublin, all areas | EUR 500,000 | USD 579,350 |
| Dublin city | EUR 480,000 | USD 556,176 |
| Wicklow | EUR 475,000 | USD 550,382 |
| Kildare | EUR 449,999 | USD 521,414 |
| State | EUR 396,000 | USD 458,845 |
| Longford | EUR 198,000 | USD 229,423 |
| Note: Exchange rate EUR 1 = USD 1.1587, as of 3 September 2026. | ||
| Data source: Central Statistics Office. | ||
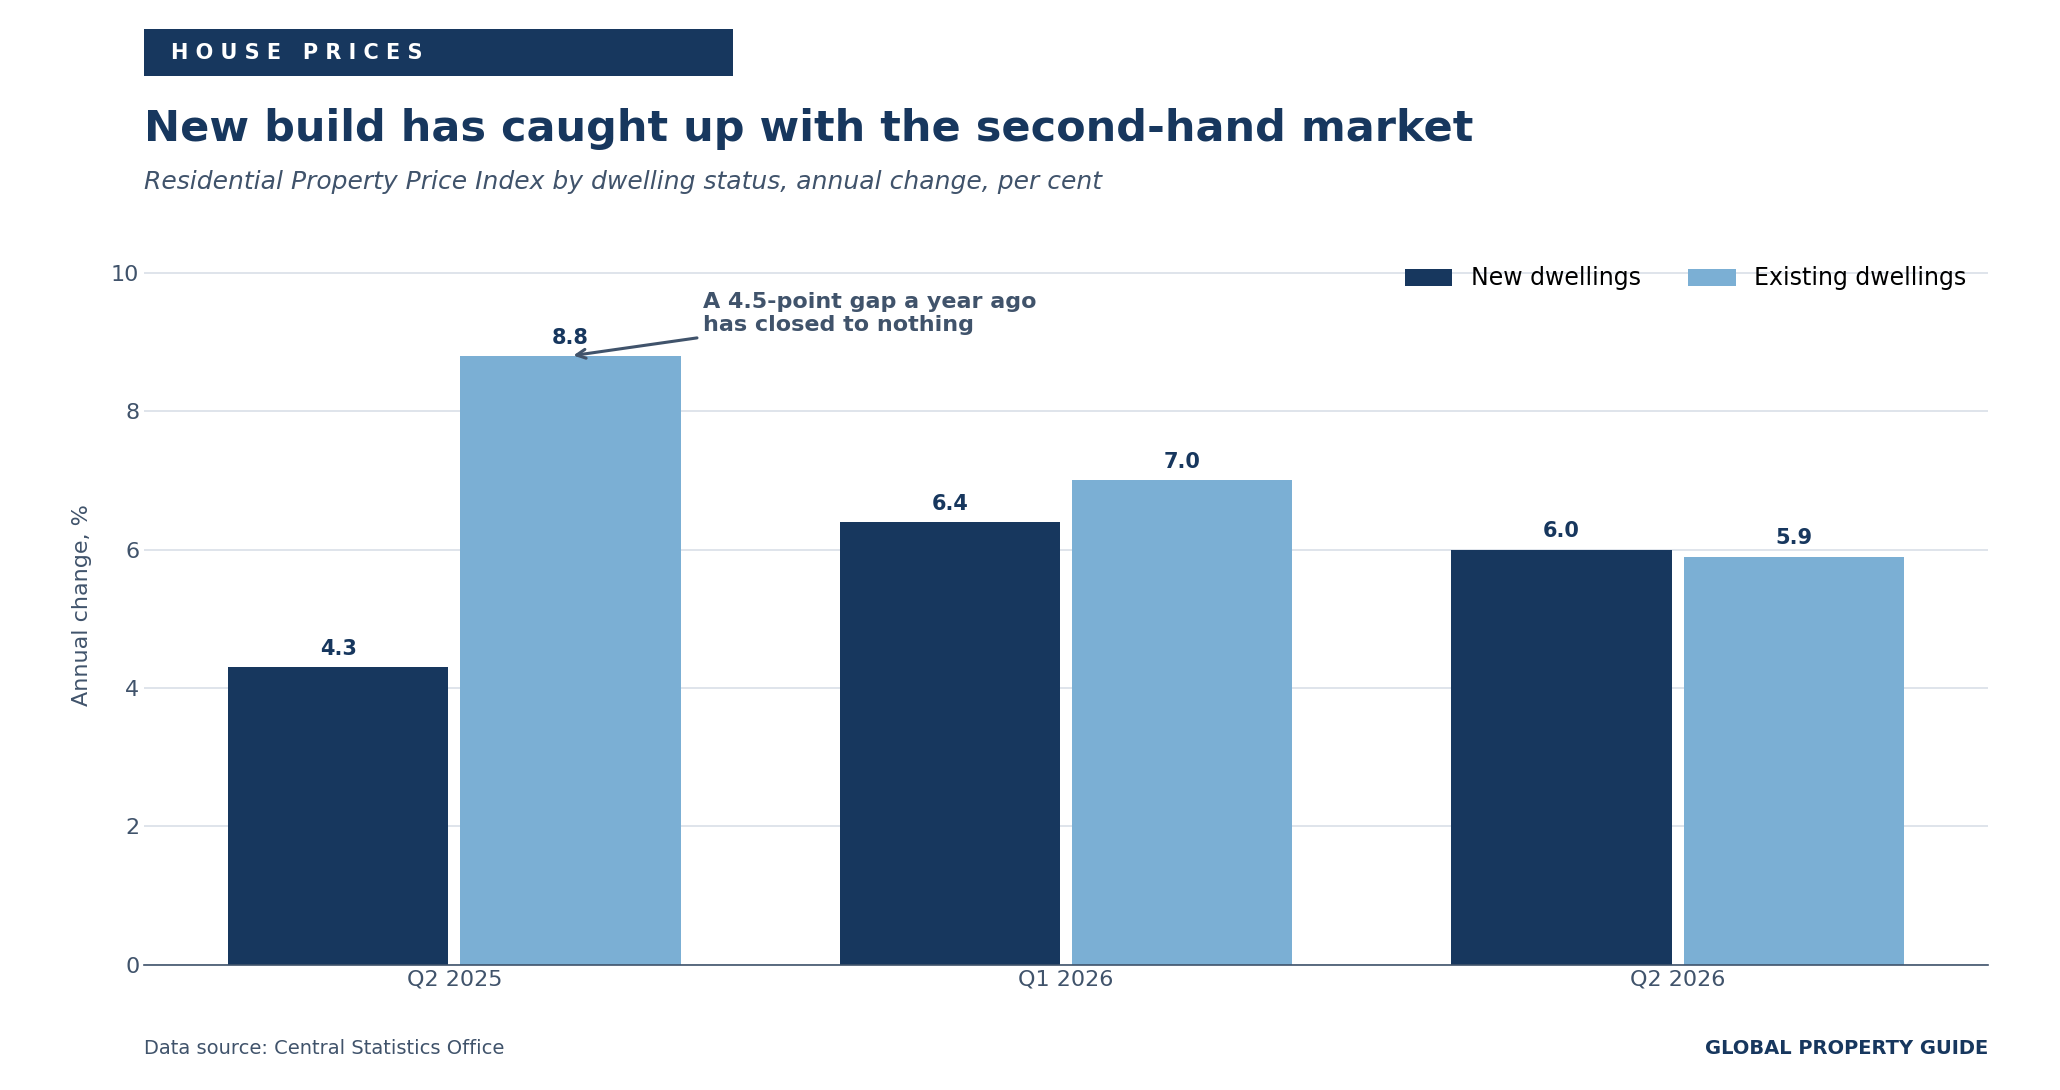
One relationship has inverted. A year ago, existing dwellings were appreciating at 8.8% against 4.3% for new builds, a gap of 4.5 percentage points that reflected acute scarcity in the second-hand market. In the second quarter of 2026, the two series had converged, with new dwellings at 6.0% and existing at 5.9%. The second-hand premium that defined the previous cycle has gone.
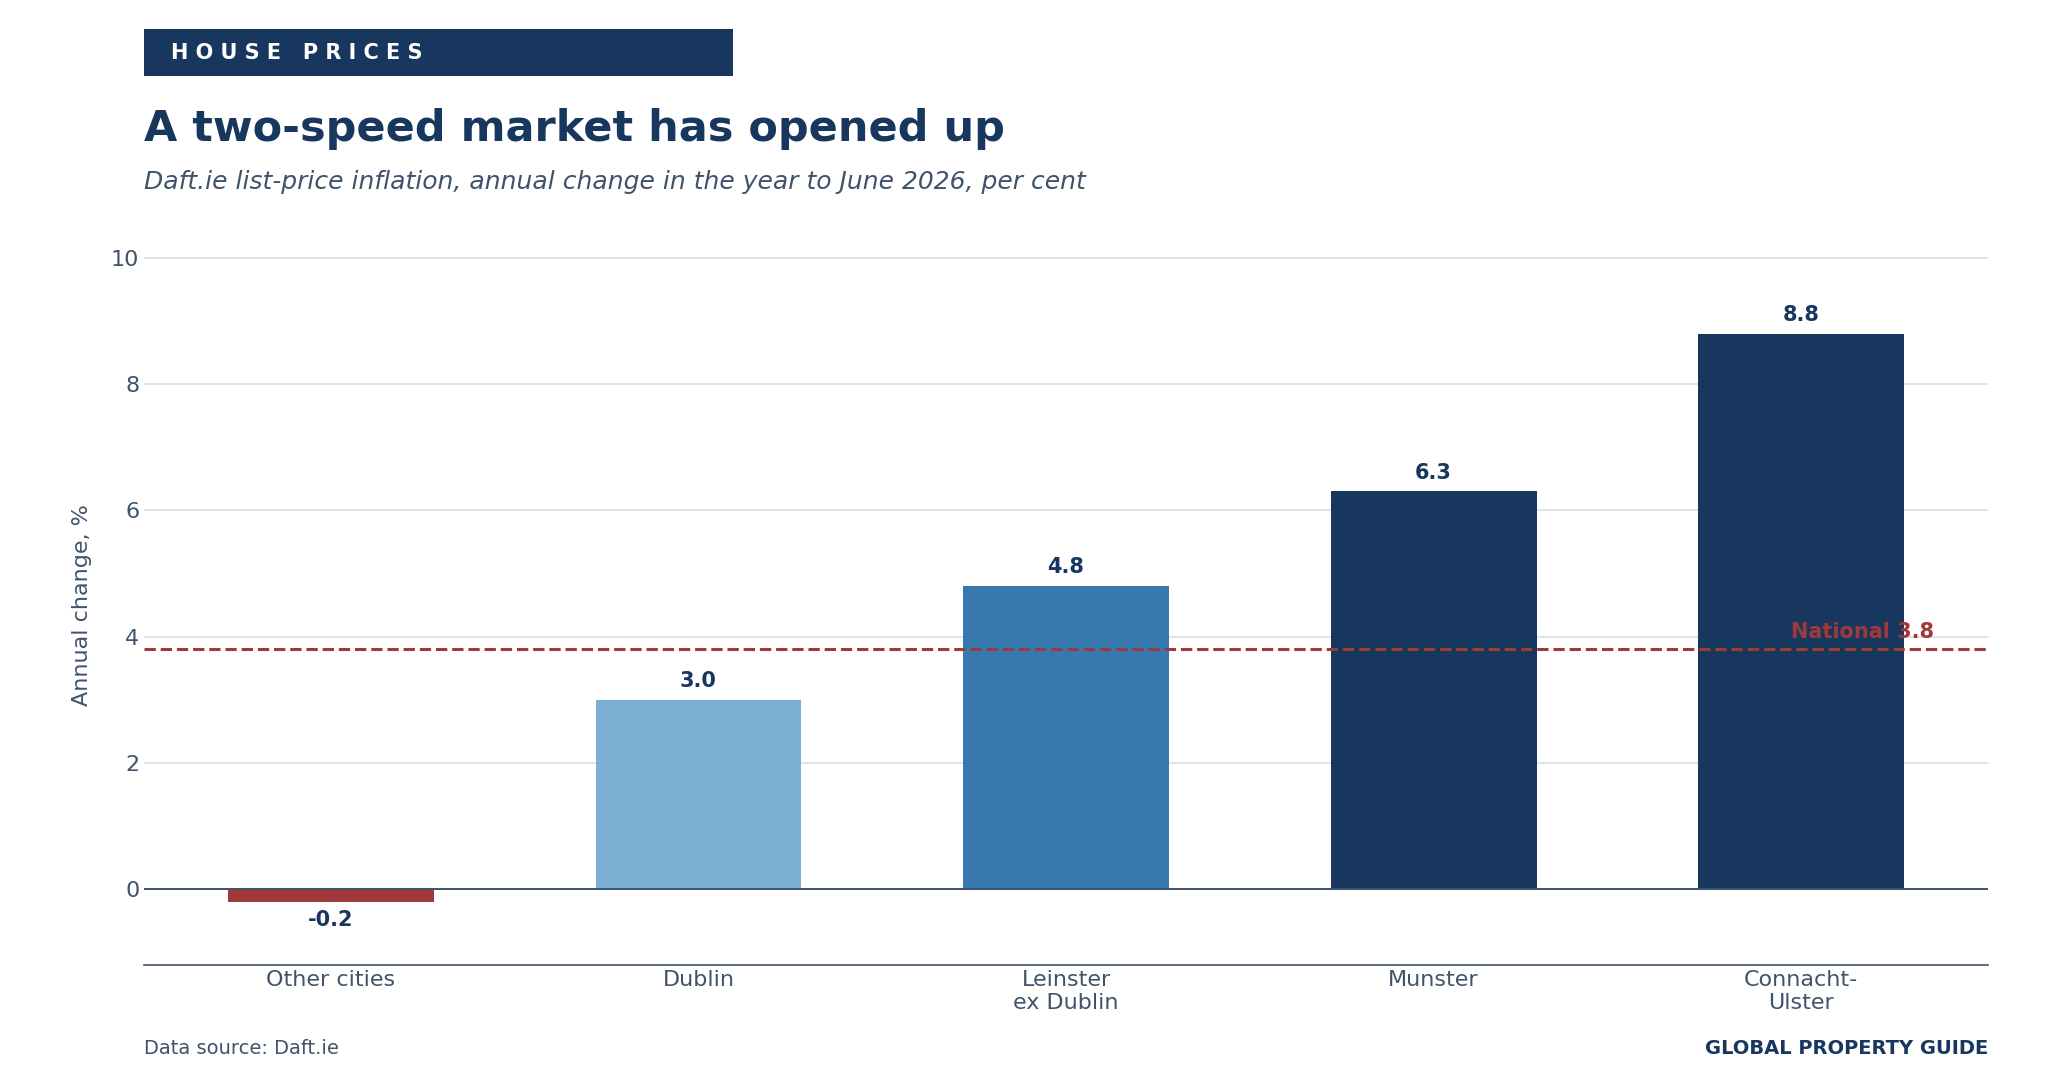
Private-sector evidence points the same way, and further. Property website Daft.ie reports that national list-price growth eased to 3.8% in the year to June 2026, from 6.8% a year earlier. Its transaction-price series shows Dublin prices 2.3% lower than in June 2025, the first annual decline since 2023, although Daft cautions that the figure may be revised as further transactions are registered. Across the other cities, list prices were essentially flat at -0.2%.
Outside the cities, the picture is unchanged. List-price inflation ran at 4.8% across Leinster, 6.3% in Munster and 8.8% in Connacht-Ulster.
Report author Ronan Lyons, Professor of Economics at Trinity College Dublin, ties the divergence to what is available to buy: it comes back to the supply picture. On 1 June there were just over 13,100 second-hand homes for sale nationwide, 6% more than a year earlier. In Connacht-Ulster the equivalent figure was 2,384, down 2% on the year and roughly 64% below the 2015 to 2019 average. The regions with the least stock are the regions with the fastest price growth.
Historic Perspective
A full cycle, and a fourth phase that is not a downturn
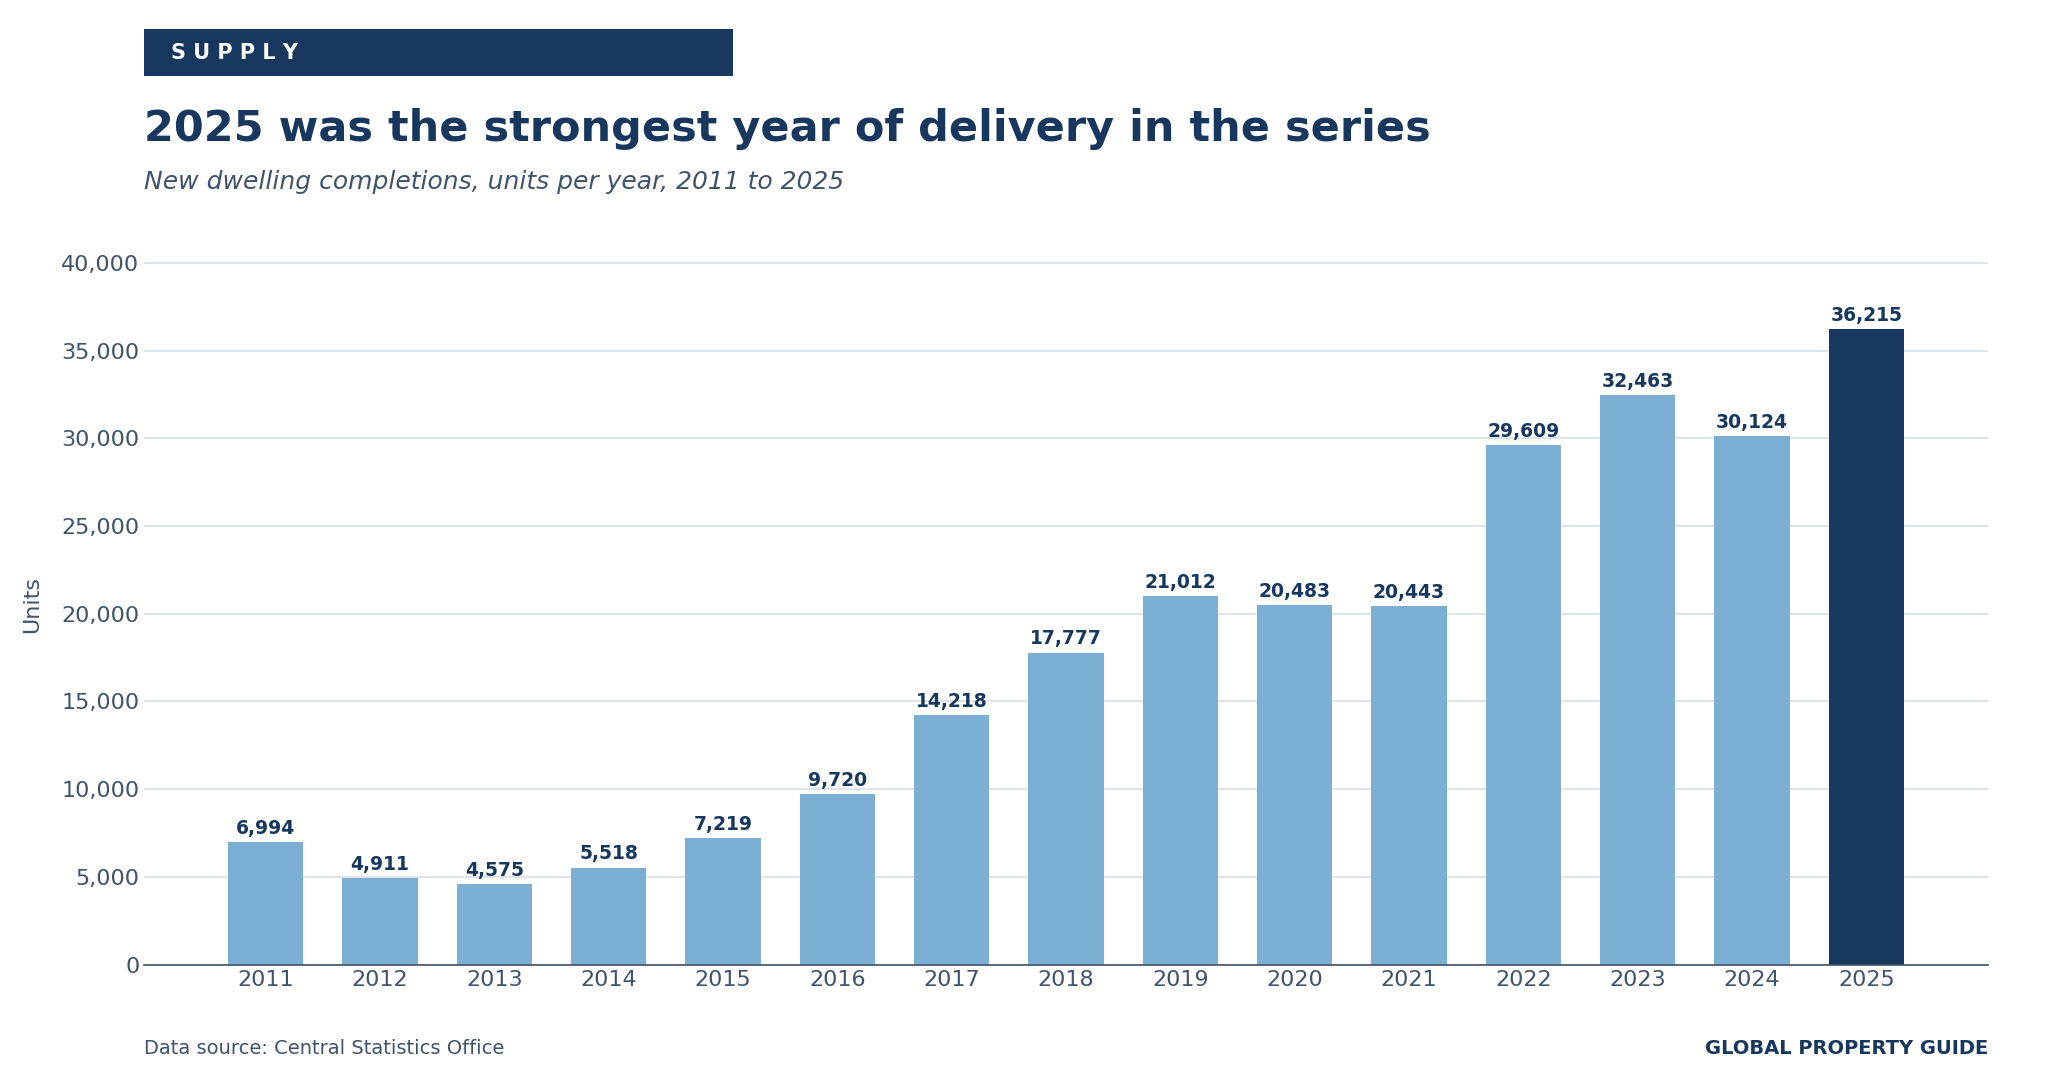
Over the past twenty years, Ireland's housing market has completed a full cycle. During the Celtic Tiger period prices rose rapidly alongside economic expansion, rising incomes, easier credit and a construction boom. That reversed sharply after the global financial crisis, when Ireland recorded one of Europe's deepest residential downturns. Prices fell for several consecutive years, and construction collapsed, with completions bottoming at 4,575 units in 2013 against more than 90,000 at the peak.
Recovery began in the early 2010s and gathered pace as macroeconomic conditions improved, before easing towards the end of that decade under tighter mortgage lending rules and Brexit-related uncertainty. The market proved resilient through the pandemic, with growth softening only briefly before re-accelerating as demand recovered faster than supply. That imbalance drove a strong pricing phase in 2021 and 2022, followed by a real-terms cooling in 2023 as inflation and financing costs rose.
The 2024 and 2025 acceleration was a scarcity story, concentrated in the second-hand market. What distinguishes 2026 is that the constraint has begun to ease in the places where it was tightest. Completions reached 36,215 units in 2025, the highest annual total since the series began in 2011 and 72.4% above the 2019 pre-pandemic level. Second-hand stock for sale has risen. Dublin, the market that led the upswing, is now the market where transaction prices have turned negative.
This is not a correction. Prices are still rising nationally, in real as well as nominal terms, and the regions remain tight. But the composition of growth has moved decisively away from the capital and towards the periphery, and away from second-hand stock towards new build. Both shifts point in the same direction: the binding constraint is loosening unevenly, and prices are responding where it loosens first.
Property Demand Trends
Transaction volumes are flat, but the mix is changing
In June 2026, 4,058 dwelling purchases by households were filed with the Revenue Commissioners, 0.7% more than in June 2025 and 5.1% up on May. Aggregate activity is close to unchanged year on year, but the split is not. Purchases of existing dwellings fell 3.8% to 2,973, while new dwellings rose 15.8% to 1,085. New builds now account for 26.7% of transactions by volume and 28.3% by value.
The total value of purchases filed in June was EUR 1.82 billion (USD 2.11 billion), up 6.8% on the year. Existing dwellings accounted for EUR 1.31 billion and new dwellings for EUR 516.1 million.
First-time buyers are carrying the market
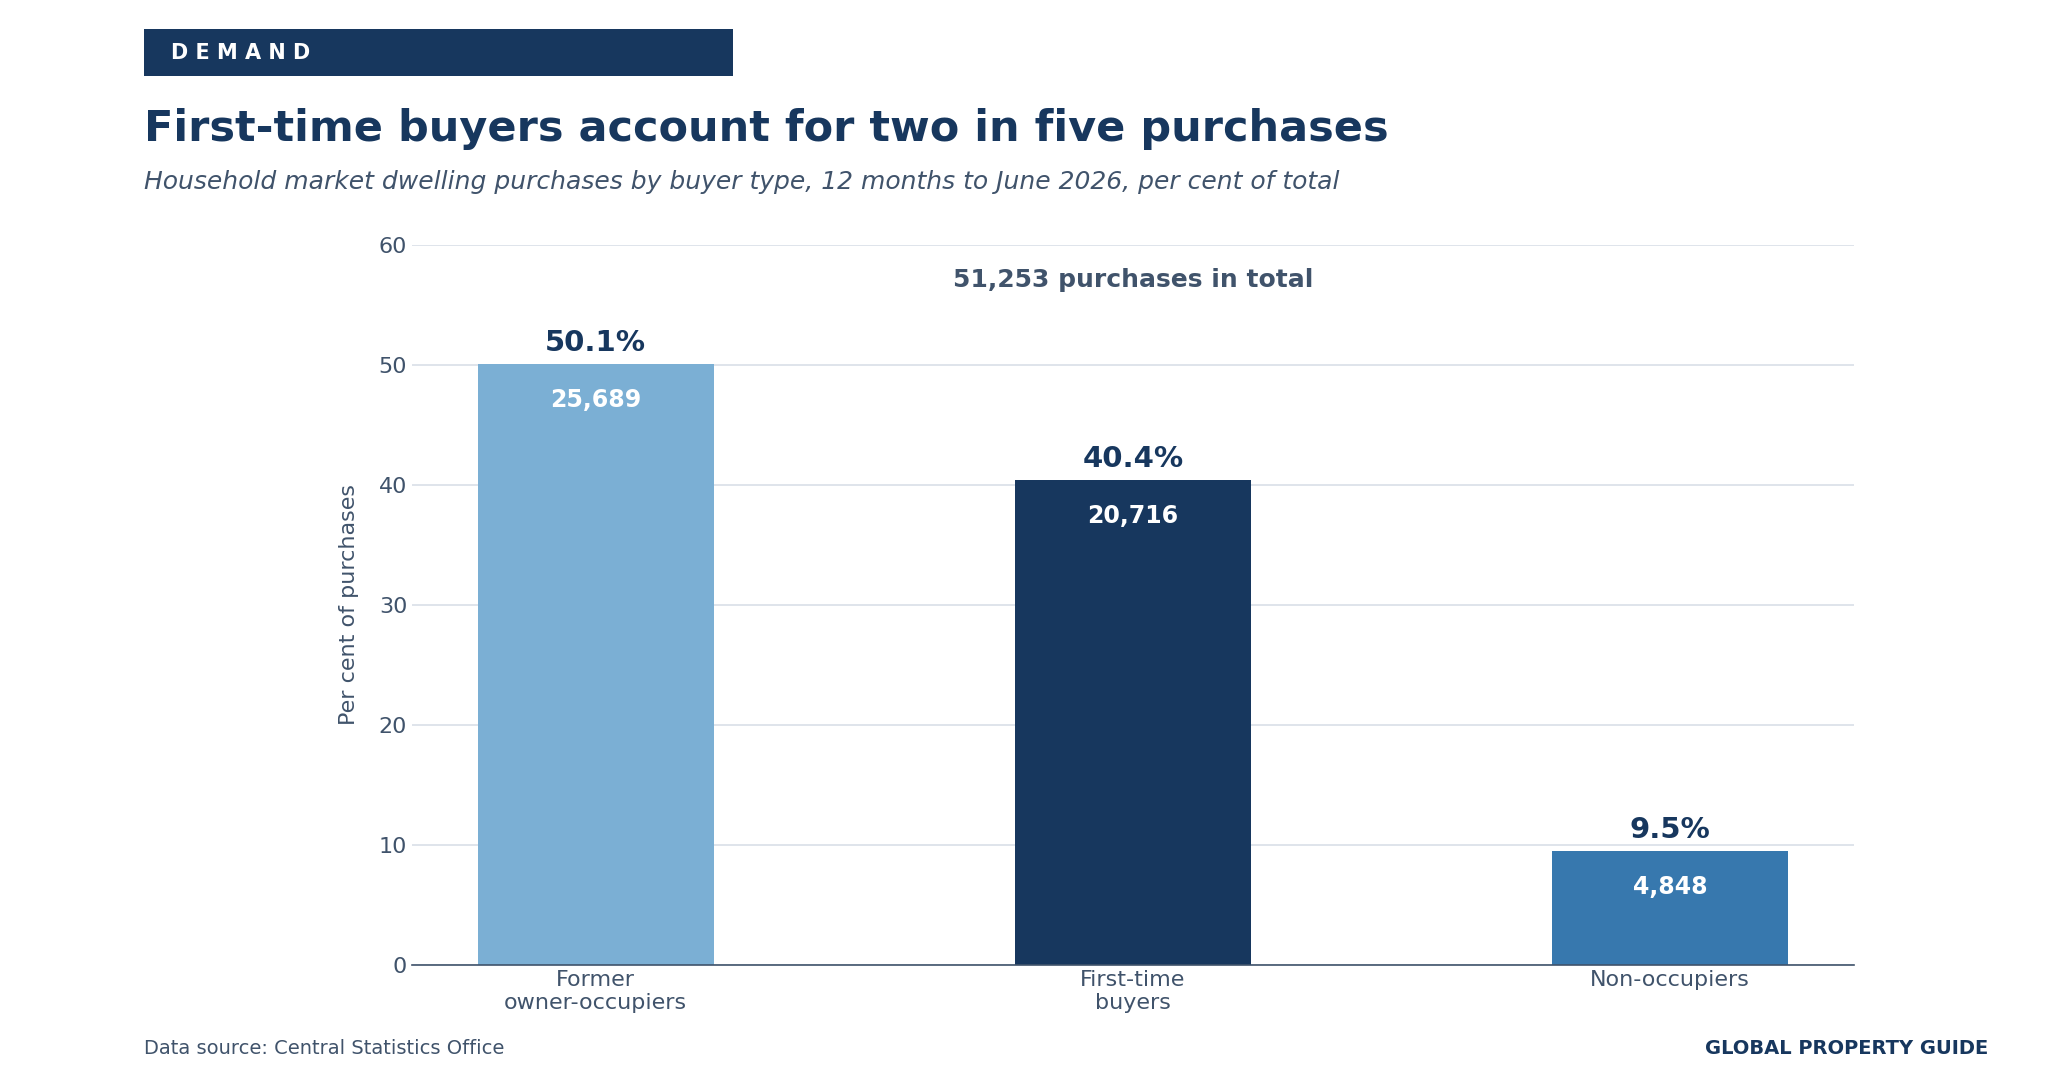
Over the twelve months to June 2026, households made 51,253 market purchases. First-time buyer owner-occupiers accounted for 20,716 of these, or 40.4%, with former owner-occupiers at 25,689, or 50.1%, and non-occupiers at 4,848, or 9.5%. In June alone, there were 1,705 first-time buyer purchases, 11.4% more than a year earlier.
The mortgage data sharpens the contrast. Banking and Payments Federation Ireland (BPFI) reported 5,626 first-time buyer drawdowns in the first quarter of 2026, the strongest first-quarter volume since 2007. Mover purchase drawdowns, by contrast, fell 9.4% to 1,768, the lowest first-quarter level since 2014.
That gap has a straightforward explanation. Movers need to sell before they buy, and in a market where replacement options are scarce, many choose not to list. First-time buyers face no such constraint. The result is a market where demand is real but circulates poorly, and where new construction increasingly does the work that second-hand turnover used to do.
There was a tentative change in the second quarter. BPFI recorded 5,499 home-mortgage drawdowns on second-hand properties, with volumes up 2.9% and values up 4.8% year on year, the first increase in second-hand mortgage volumes since the first quarter of 2025. One quarter does not establish a trend, but it is consistent with the rise in second-hand listings.
Property Supply Trends
The quarterly headline understates the year
New dwelling completions fell 3.6% year on year to 8,823 units in the second quarter of 2026. The decline was concentrated in apartments, down 12.2% to 2,658. Scheme dwellings rose 2.0% to 4,738, and single dwellings fell 3.7% to 1,427.
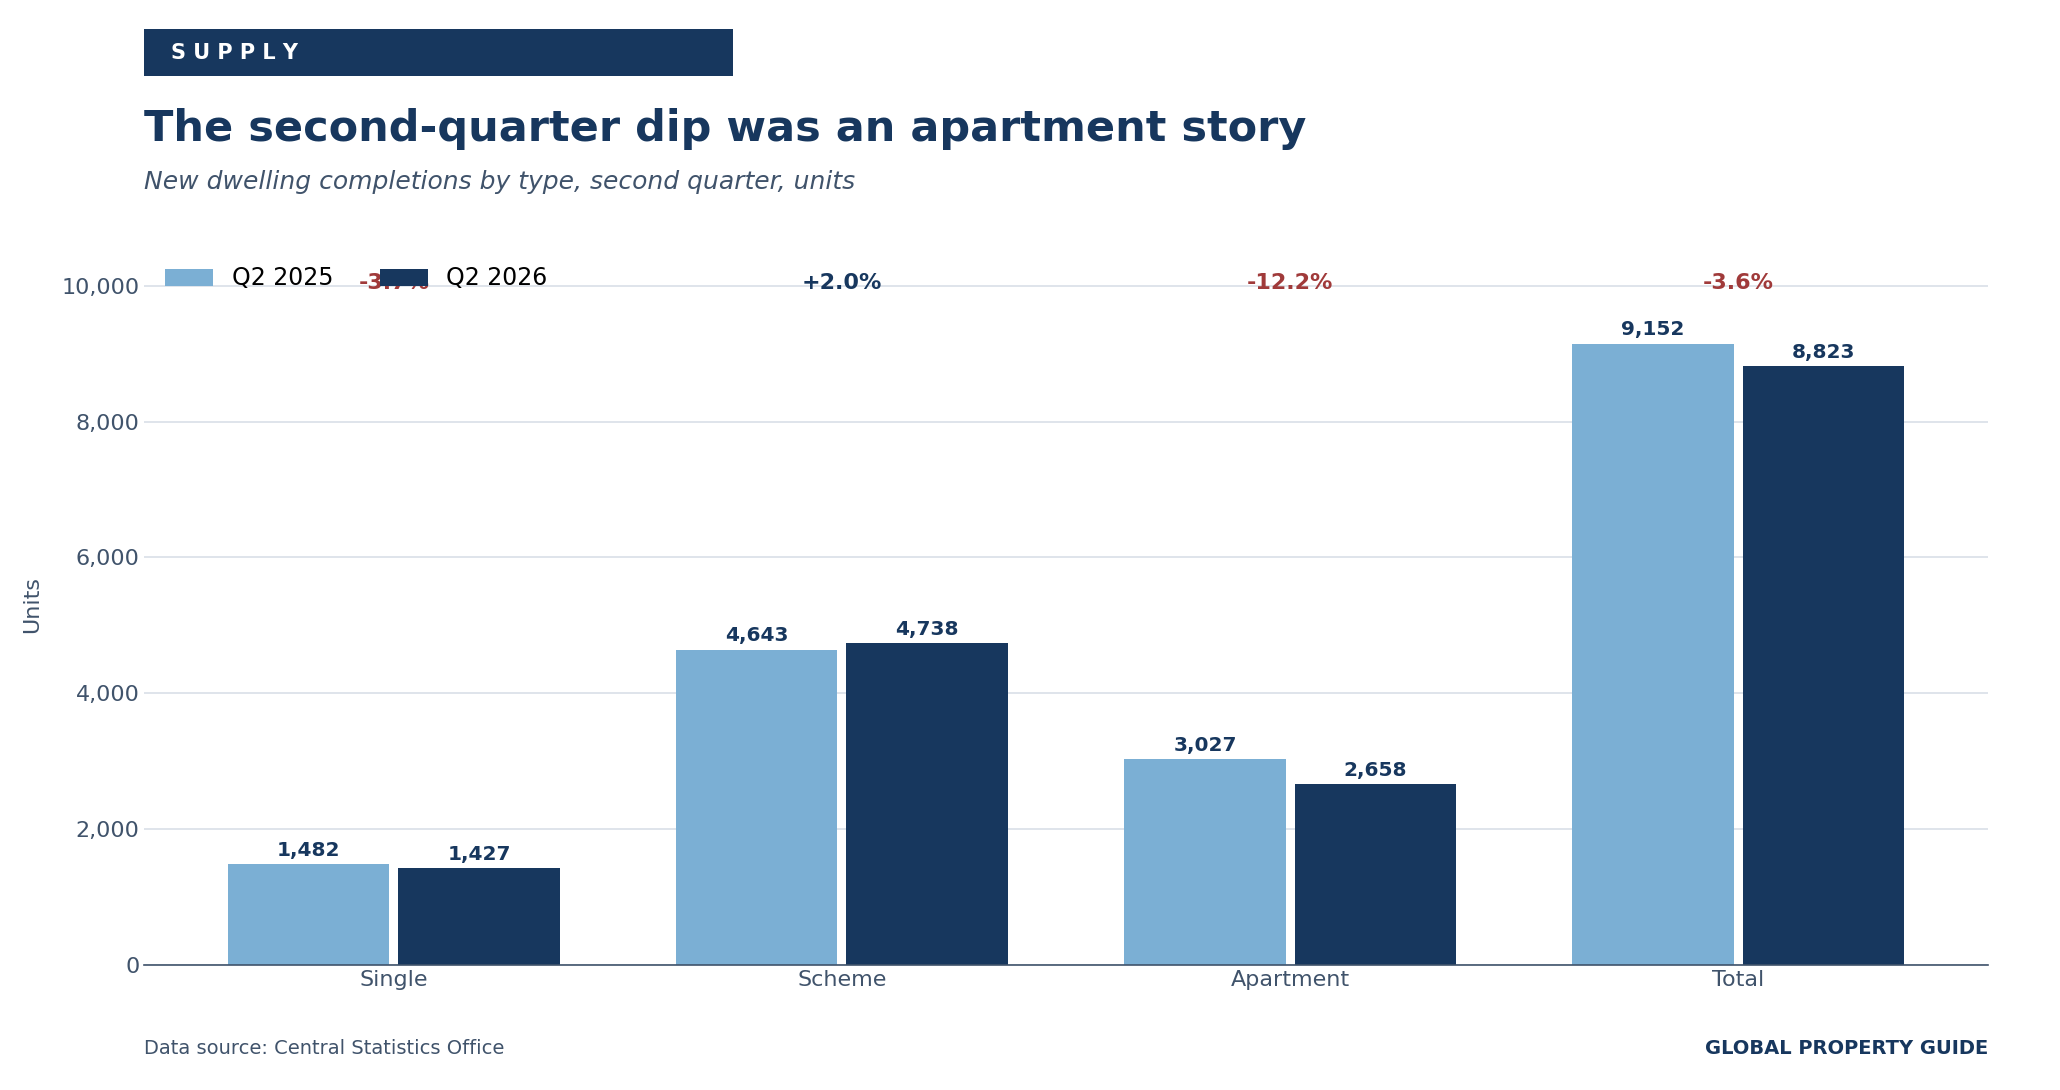
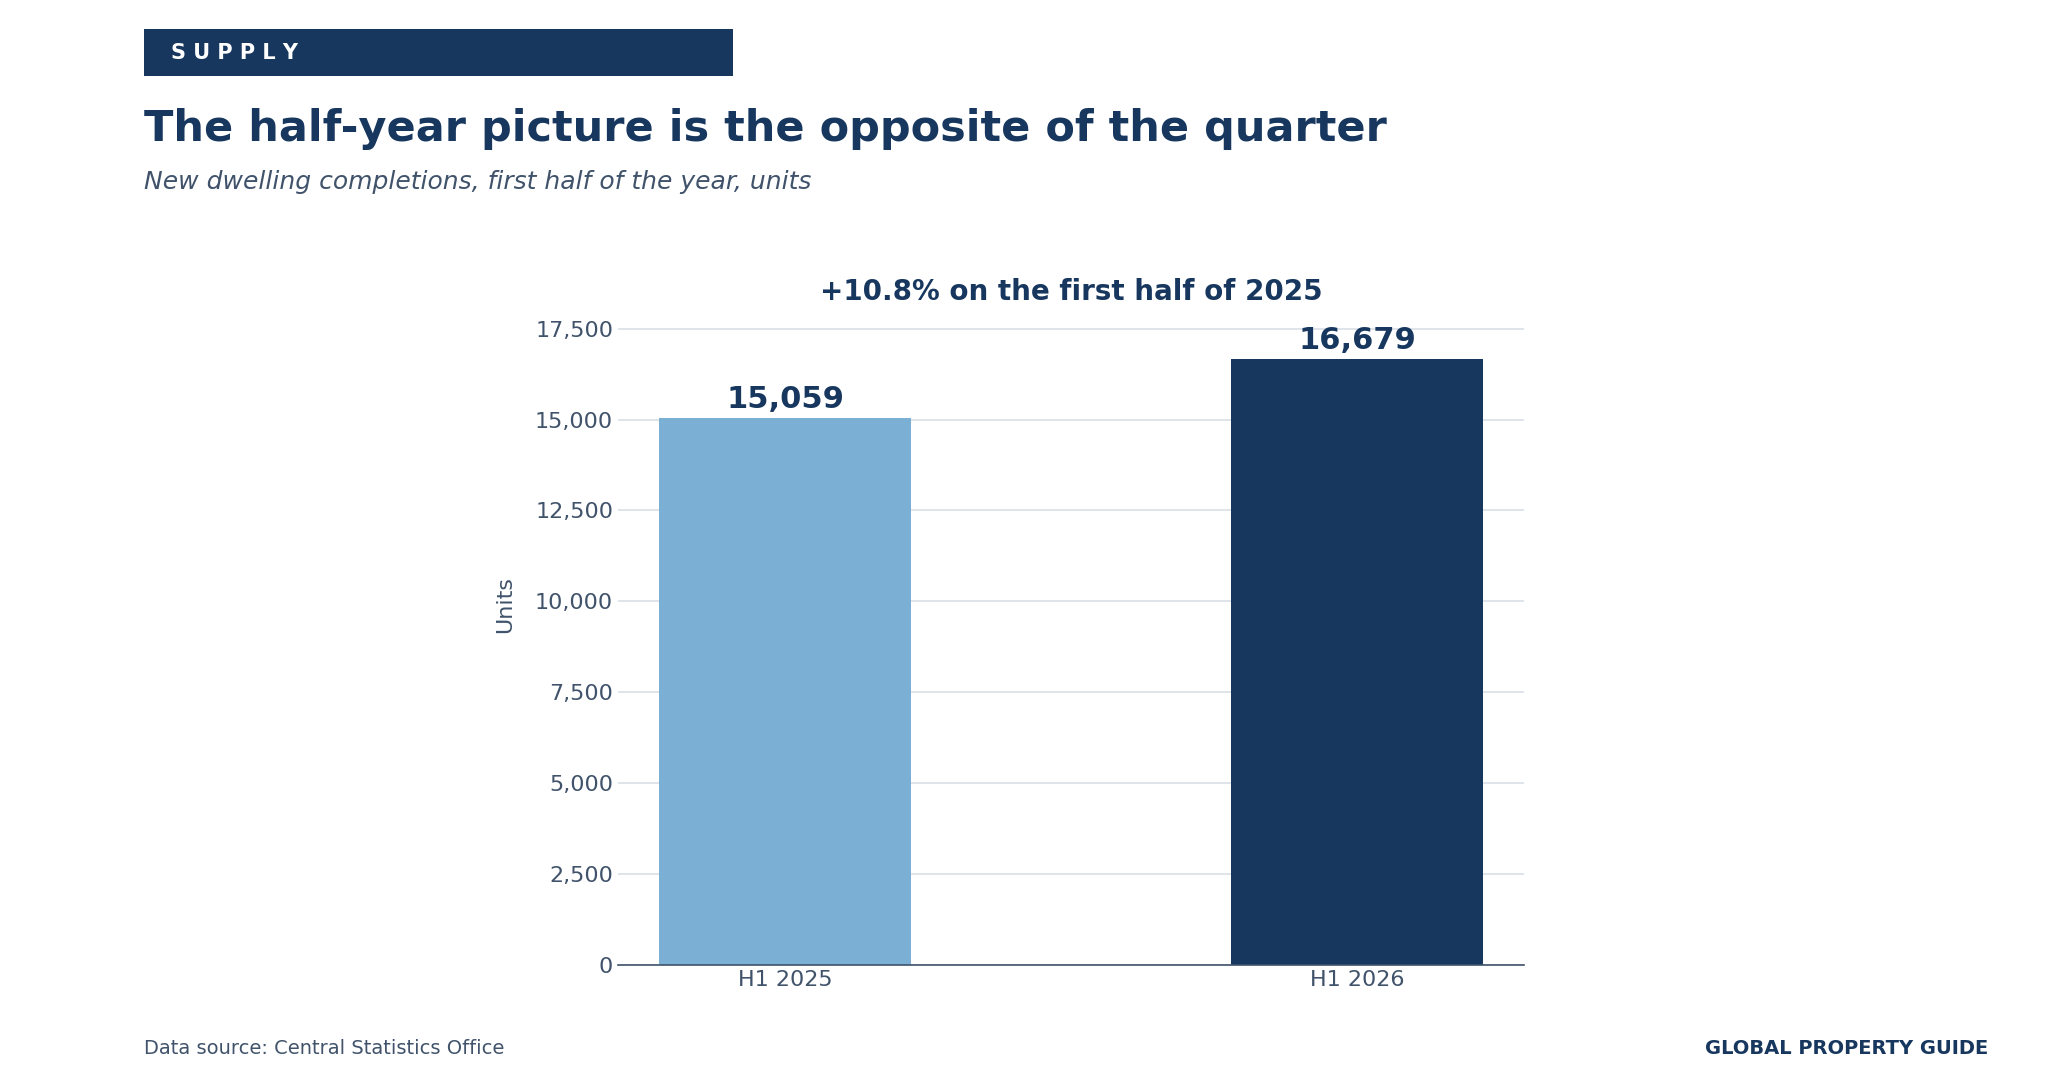
Read on its own, that looks like a reversal. Read across the half-year, it is not. Completions in the first quarter of 2026 reached 7,856, a rise of 32.9% on the same period of 2025 and the highest first-quarter total since the series began in 2011. Across the first half, output totalled 16,679 units against 15,059 a year earlier, an increase of 10.8%.
Regionally, completions fell in only two of the eight regions: Dublin, down 16.4%, and the Mid-West of Clare, Limerick and Tipperary, down 13.9%. The Border region grew fastest at 14.6%, followed by the South-East at 12.0% and the Mid-East at 9.4%. Dublin nonetheless accounted for 36% of all completions and 75.5% of apartment completions, and 91.4% of everything completed in Dublin City was an apartment.
Commencements have rebounded, vindicating a forecast that looked optimistic
The previous edition of this report recorded 16,412 dwelling commencements in 2025, a fall of 76.3%, and quoted the Minister for Housing, James Browne, saying that he expected commencements to rise in 2026. They have, and by more than almost anyone anticipated.
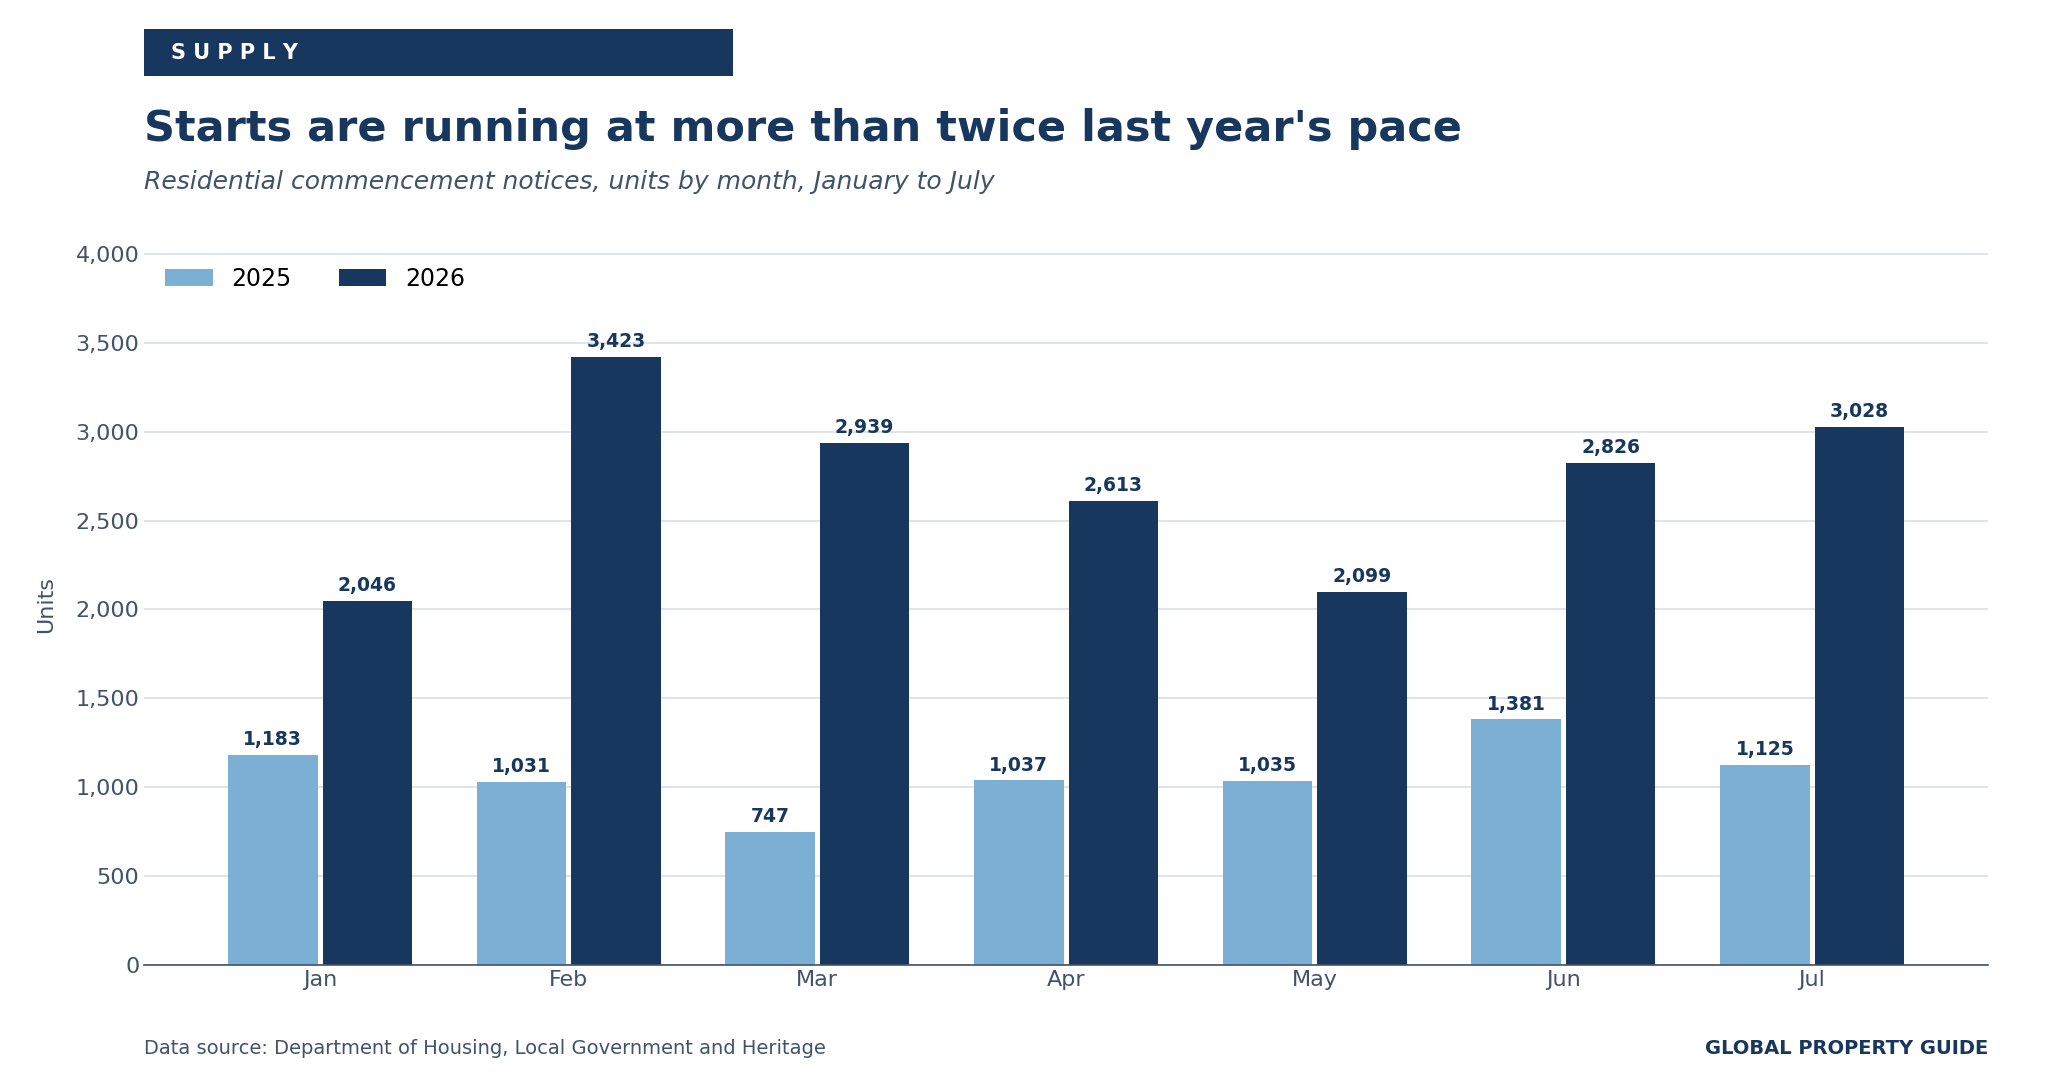
The Department of Housing, Local Government and Heritage reported 18,974 units commenced between January and July 2026, up 152% on the 7,539 recorded in the same period of 2025. Seven months of 2026 have already exceeded the whole of 2025. It is the second-highest January-to-July total since records began in 2014.
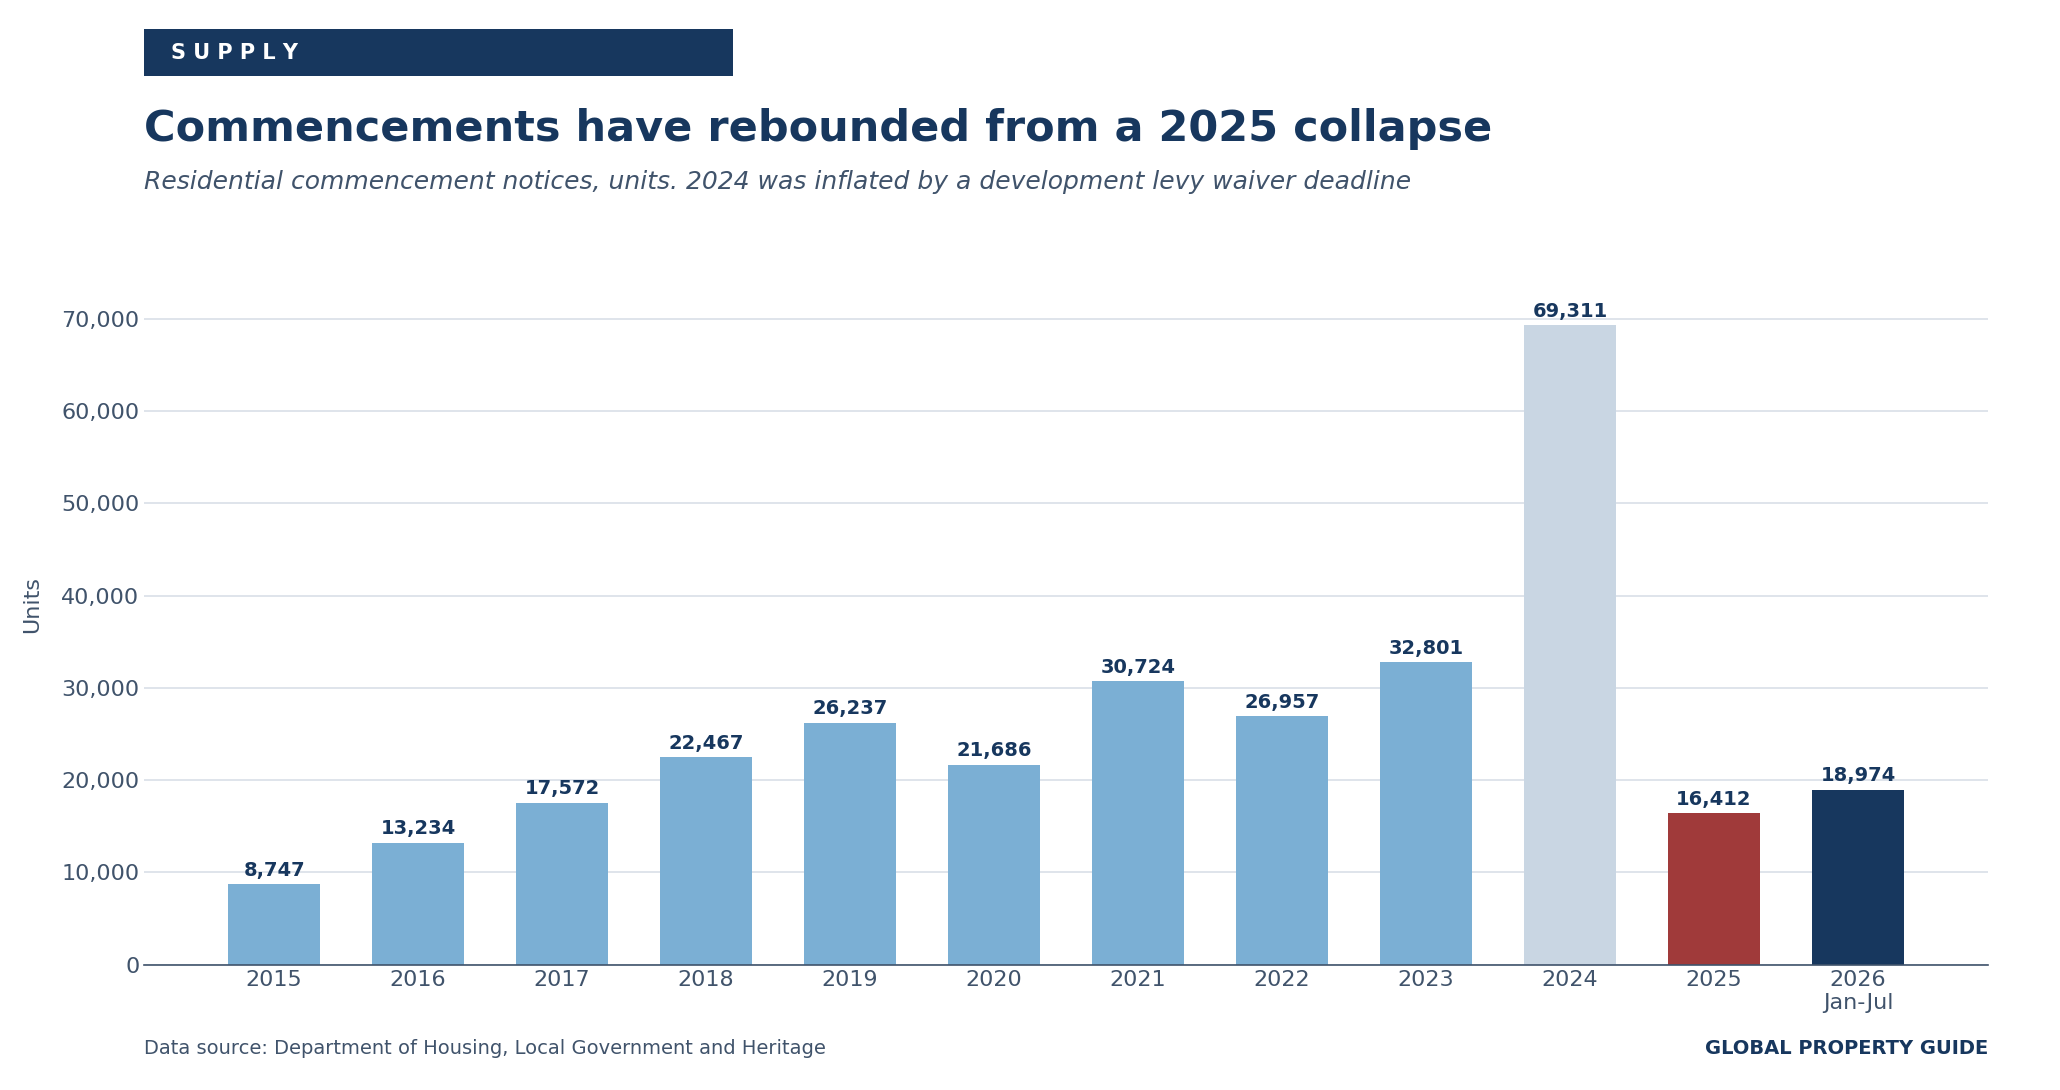
Two caveats matter. The first is that 2024, the only year with a higher seven-month total, was distorted by policy. A development levy waiver and an Uisce Éireann rebate expired in April 2024, and 18,700 units were commenced in that single month, 27% of the whole year. The 2025 collapse was the unwinding of that pull-forward rather than a market event.
The second is that 2026's recovery does not share that shape. Monthly commencements have run between 2,046 and 3,423 across the seven months, with no deadline spike. February was the strongest month at 3,423, only 18% of the seven-month total. Whatever is driving the rebound, it is not a single expiring incentive.
By type, scheme dwellings accounted for 9,262 units of the January-to-July total, apartments for 6,987 and one-off homes for 2,725. Apartments at 36.8% of commencements sit well above their 30% share of completions, which suggests the delivery mix will continue shifting towards apartments.
BPFI warned in April that a significant increase in commencement activity in the first half of 2026 would be required to sustain output beyond 2026, given that 2025 starts were the lowest since 2016. That condition has been met. The open question has moved downstream, to how quickly starts convert into completions.
The Department of Finance has pointed to a considerable slowdown in the time from commencement to completion following the levy-waiver spikes, implying that traditional rules of thumb may currently overstate the speed of conversion. The Central Bank of Ireland has noted that the historical link between commencements and completions has been disturbed by policy-induced volatility. Bank of Ireland expects completions of around 40,000 units in 2027.
Average dwelling size continues to fall. The CSO's size index stood at 69 in the first half of 2026 against a 2016 base of 100, with the average completed dwelling at 115.4 square metres compared with 166.9 square metres a decade earlier. More units are being delivered, and each is smaller.
Rental Market: Rents and Rental Yields
A regulatory reset produced a record quarter, then faded
The rental reforms that the previous edition of this report described as imminent took effect on 1 March 2026, and their effect was immediate and large. Rent Pressure Zones as a designated geographic system were replaced by a single national rent control regime covering every private tenancy. New tenancies became Tenancies of Minimum Duration with a six-year term. Within a tenancy, annual increases remain capped at inflation to a maximum of 2%. Critically, where a tenancy ends, a landlord may reset the rent to market level, provided no no-fault eviction occurred.
Ireland's rent price index:
Daft.ie recorded a 4.4% rise in national market rents between December and March, the largest quarterly increase in a series stretching back to 2002. Between March and June the increase was 1.4%, slightly below the 1.6% average quarterly rise of the past decade.
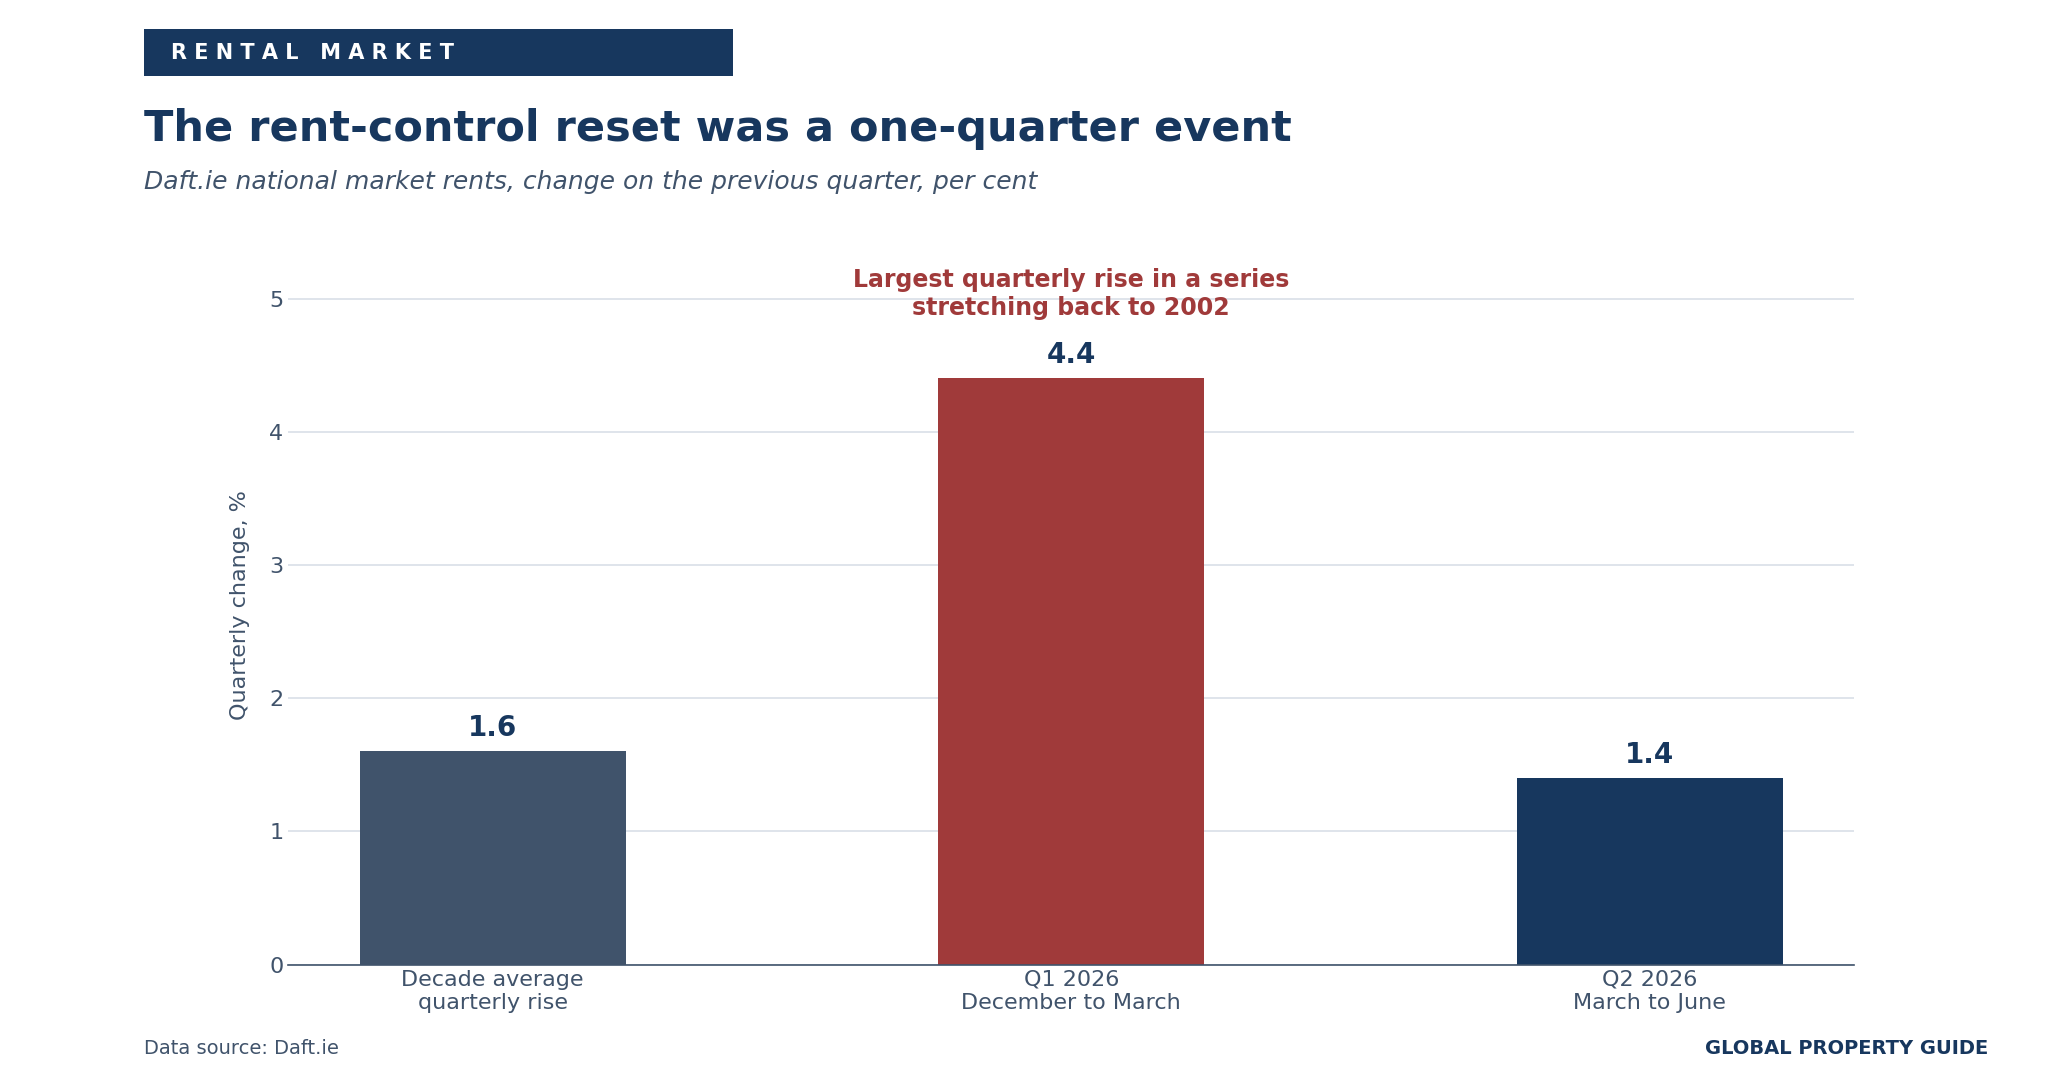
Lyons reads the second quarter as a clear read on the new system, and concludes that the surge in rents in early 2026 was a one-off reset rather than the start of a new trend. His reasoning is mechanical: where a tenancy ends, the landlord may bring the rent to market level, which is a one-time correction rather than a recurring increase, and once those tenancies have turned over, the effect fades.
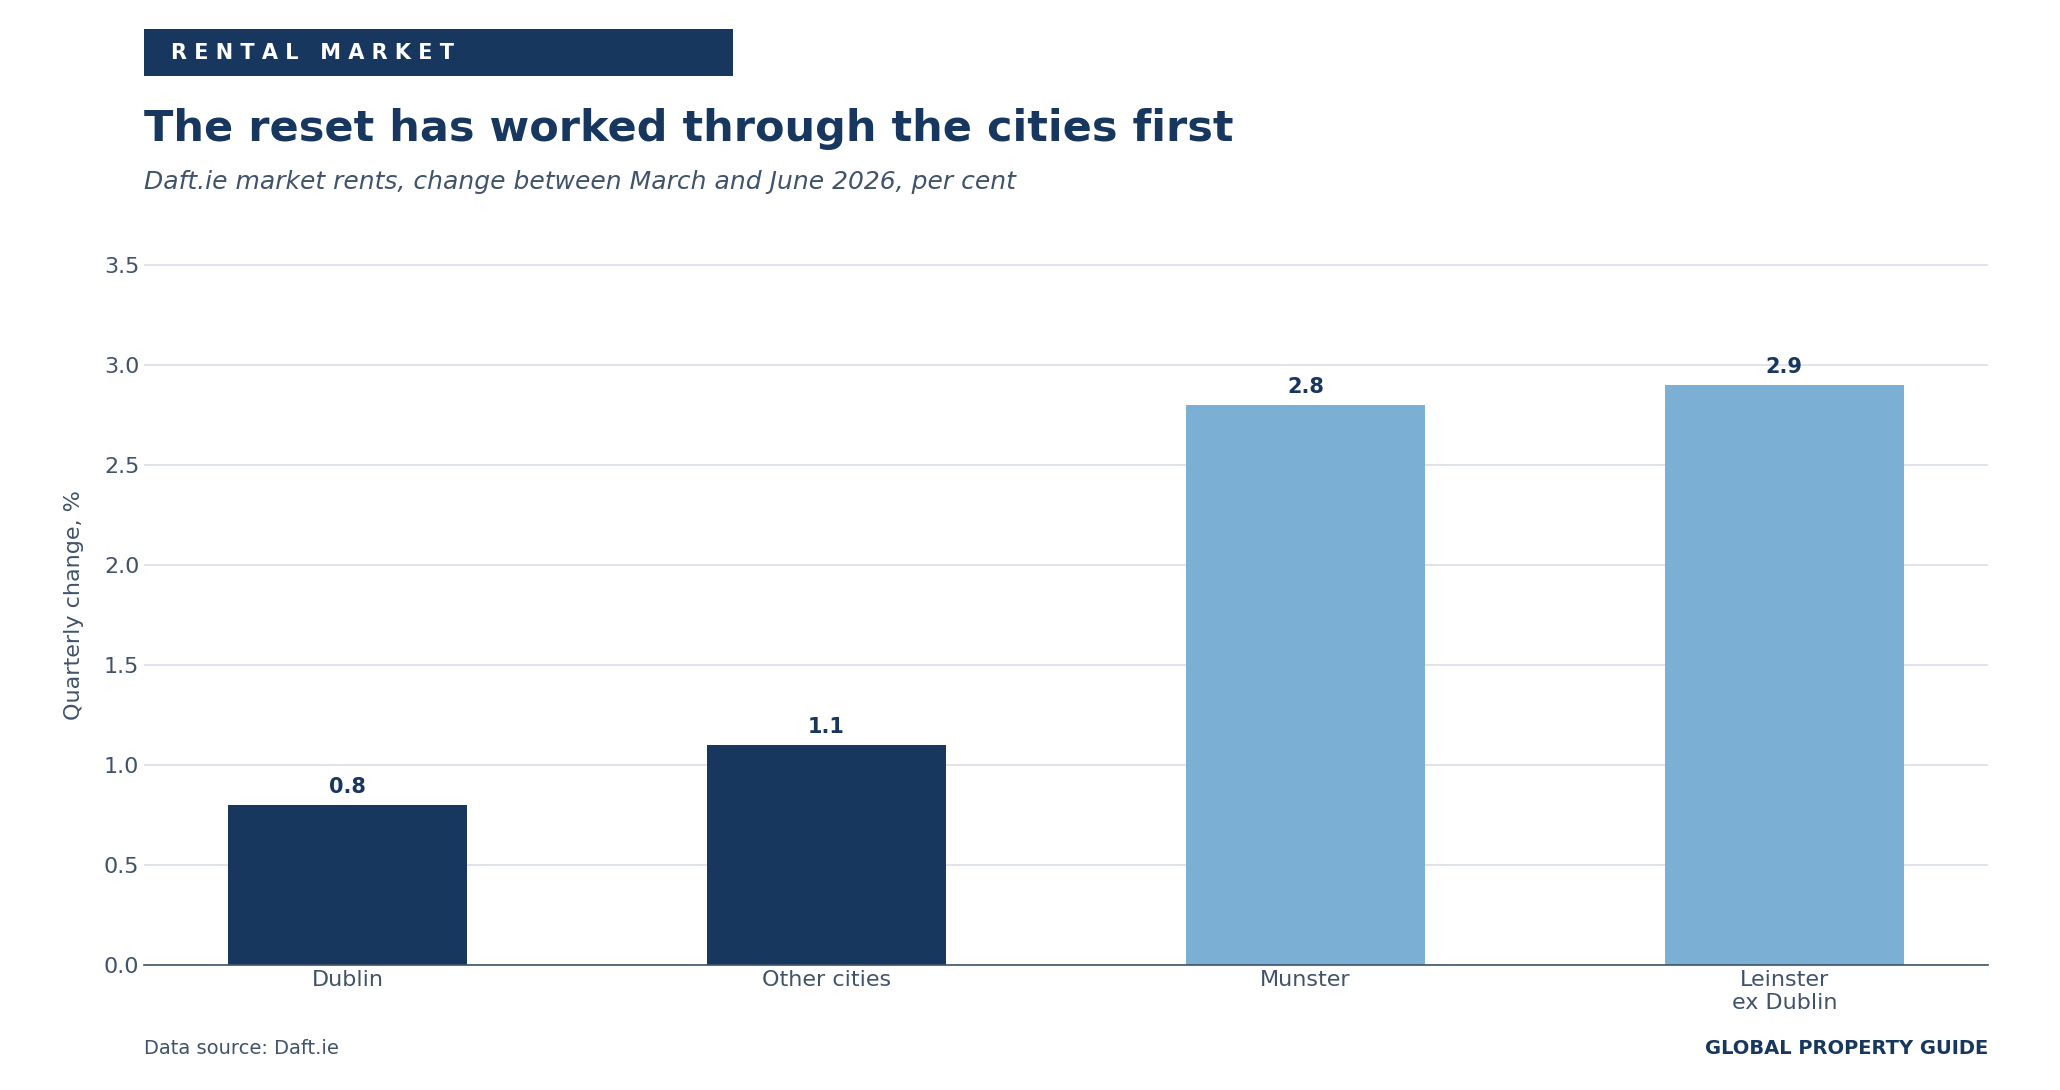
The geography of the second quarter supports that reading. Rents rose 0.8% in Dublin and 1.1% across the other cities, against 2.9% in Leinster and 2.8% in Munster. The adjustment appears largely complete in the cities and is still working through elsewhere.
Annual figures need care over the coming quarters. National rent inflation remains close to 8%, but largely because the first-quarter surge is still inside the twelve-month window. Lyons expects the annual rate to fall sharply in early 2027 when that quarter drops out, an effect of arithmetic rather than evidence that the system has succeeded or failed.
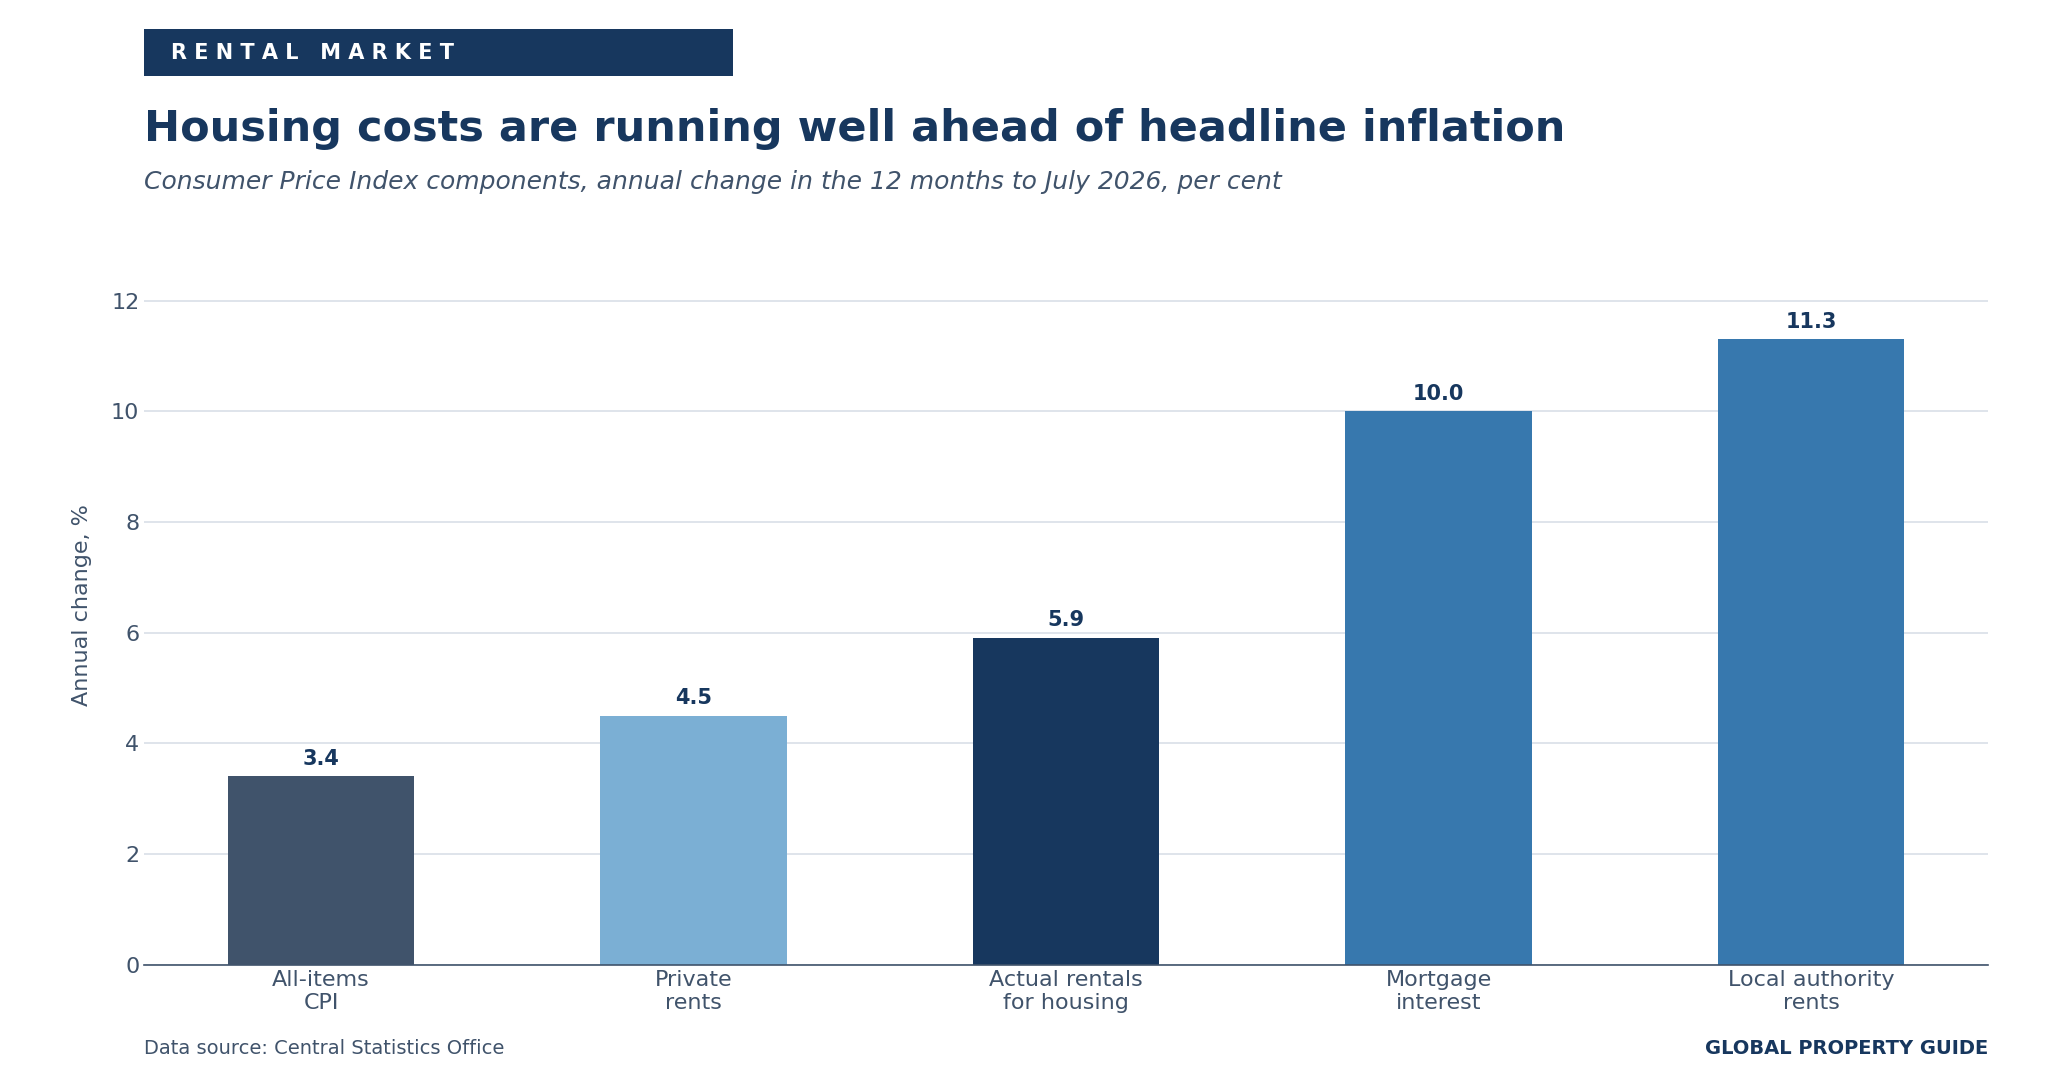
The CSO's Consumer Price Index tells a consistent story. Actual rental payments for housing rose 5.9% in the year to July 2026, against an all-items CPI increase of 3.4%. Within that, private rents rose 4.5% and local authority rents 11.3%. Mortgage interest rose 10.0%.
The previous edition of this report recorded rent inflation of 3.3% in January 2026 against headline inflation of 2.7%, and described the gap as narrowing to its smallest since the pandemic. That gap has since widened from 0.6 percentage points to 2.5.
The Dublin premium has collapsed
The average open-market rent for a two-bedroom apartment nationally reached EUR 2,204 (USD 2,554) per month in the second quarter of 2026, from EUR 2,086 in the fourth quarter of 2025. Annual increases by city ran at 13% in Galway, 12% in Cork, 11% in Limerick, 6.5% in Dublin in June and 5.5% in Waterford. Outside the cities, annual inflation was between 9% and 10% across Leinster, Munster and Connacht-Ulster.
The cumulative effect is a structural change that Lyons identifies as the most striking development of the past five years. A two-bedroom apartment in Dublin cost close to three times its Connacht-Ulster equivalent for most of the 2010s, peaking at just over three times in 2018. That ratio has now fallen below 2, its lowest since the series began in 2004. Dublin rents are about a quarter above their pre-Covid level; rents in Connacht-Ulster are 90% higher and in Munster 75% higher over six years.
Lyons draws the policy conclusion directly: rental scarcity is a national problem, and measures to bring forward new market rental supply need to be capable of working outside Dublin.
On 1 August 2026 there were just under 2,400 homes available to rent nationwide, 5% more than a year earlier. That national figure conceals a sharp divide. Availability in Dublin fell 18% over the year to fewer than 1,150 homes, while across the rest of the country it rose 40%. Both remain far below pre-pandemic norms, when over 4,300 homes were typically available at any one time.
The supply-side context is a continued exit of small landlords. The Residential Tenancies Board recorded notices to quit rising 51% ahead of the March change. The Housing Agency's review of Rent Pressure Zones found that while the trend cannot be definitively proven, the available evidence suggests small landlords have exited to some extent, and that some exits appear to have been precipitated by the 2% cap. It also found those exits had been compensated by institutional investment, though largely concentrated in Dublin.
Yields remain high by European standards
Research conducted by Global Property Guide in June 2026 found gross rental yields averaging 7.66%, against 7.71% in December 2025. The national average is stable, but the composition is not.
Dublin's average yield fell from 7.22% to 7.00%, while Cork's rose from 8.20% to 8.33%. The gap between the two cities widened from 0.98 to 1.33 percentage points.
This is the yield-market expression of the same divergence visible in the rent and price data: Dublin rents rose only 0.8% in the second quarter while capital values held up, compressing yields, whereas regional rents rose far faster.
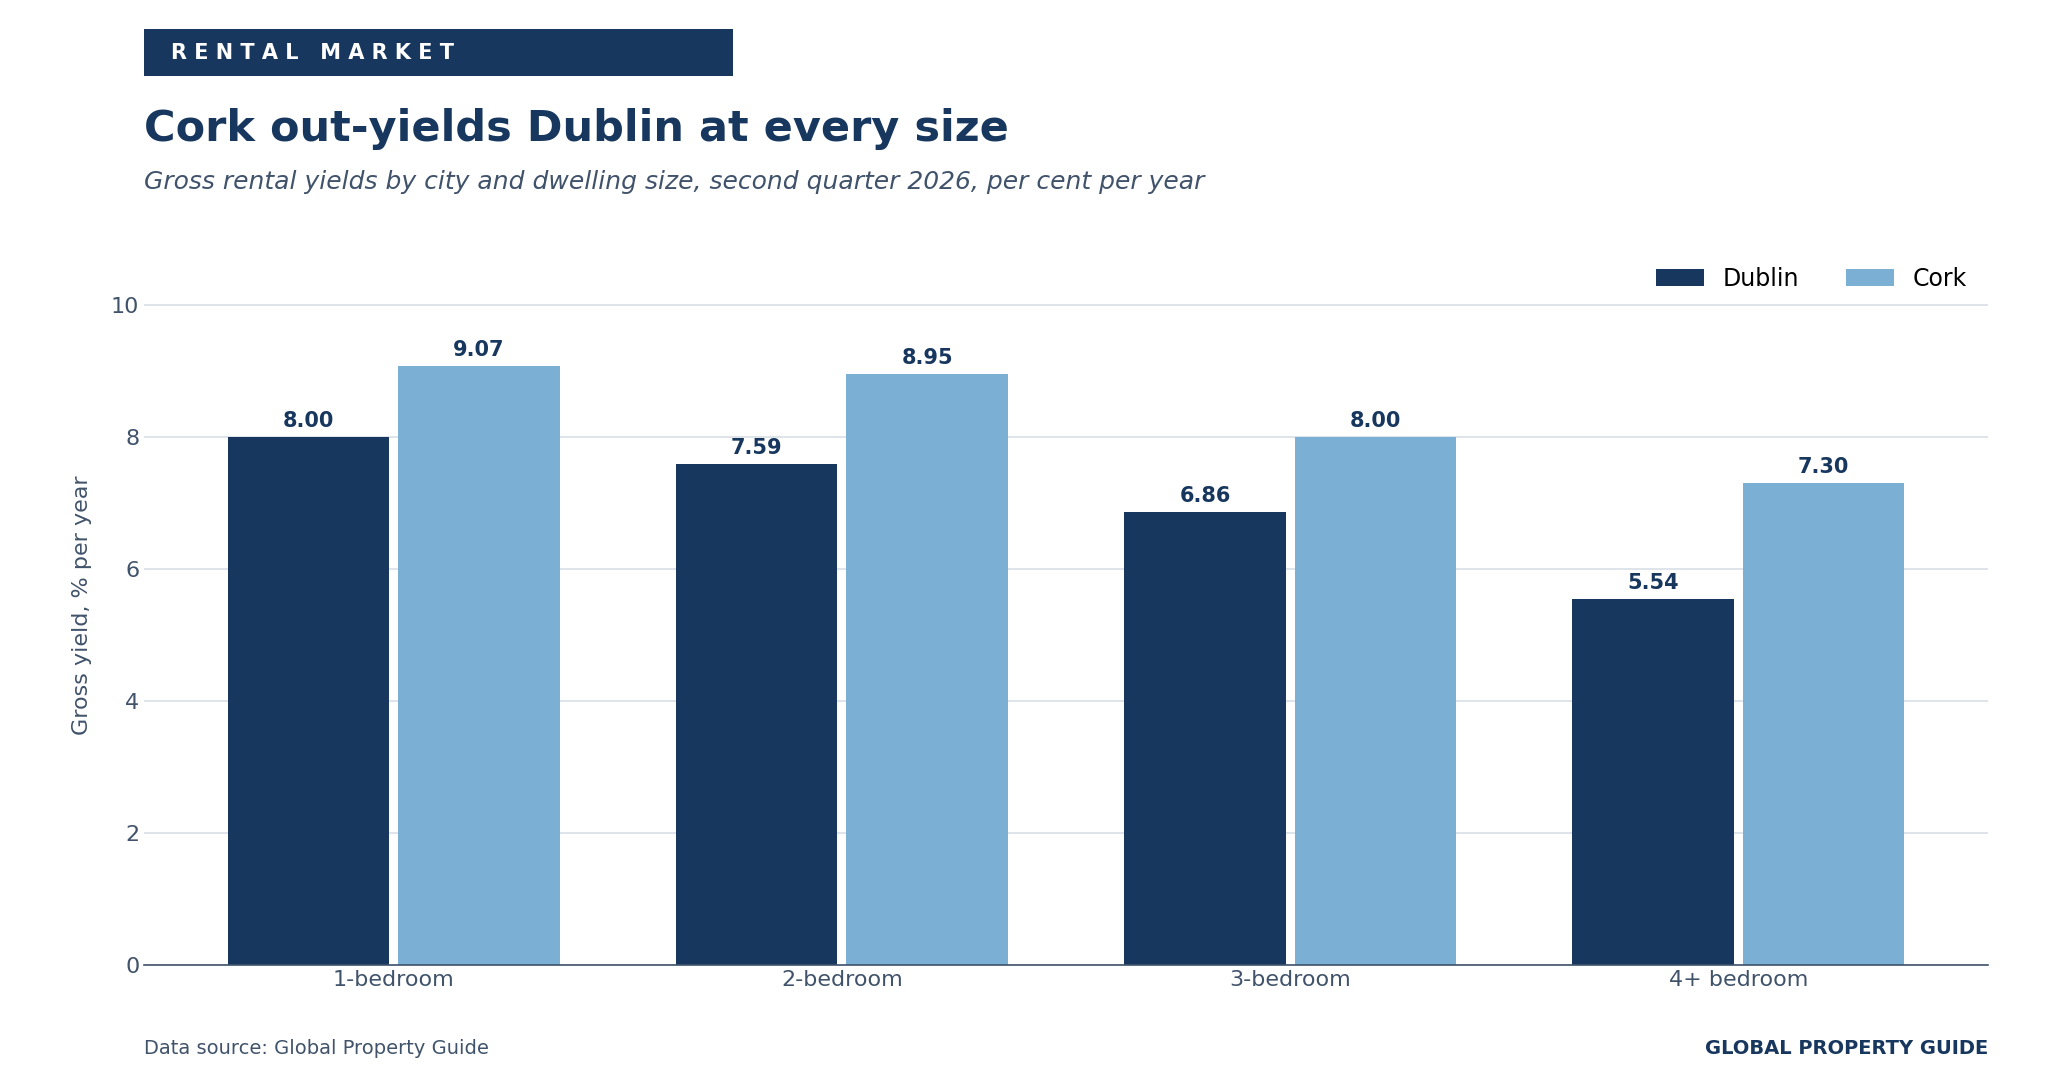
Gross rental yields by city and dwelling size, second quarter 2026:
Smaller units return the most. A one-bedroom apartment yields 8.00% in Dublin and 9.07% in Cork, against 5.54% and 7.30% respectively for four-bedroom properties. Net yields are typically 1.5 to 2 percentage points lower than gross.
Mortgage Market and Interest Rates
The European Central Bank has resumed tightening
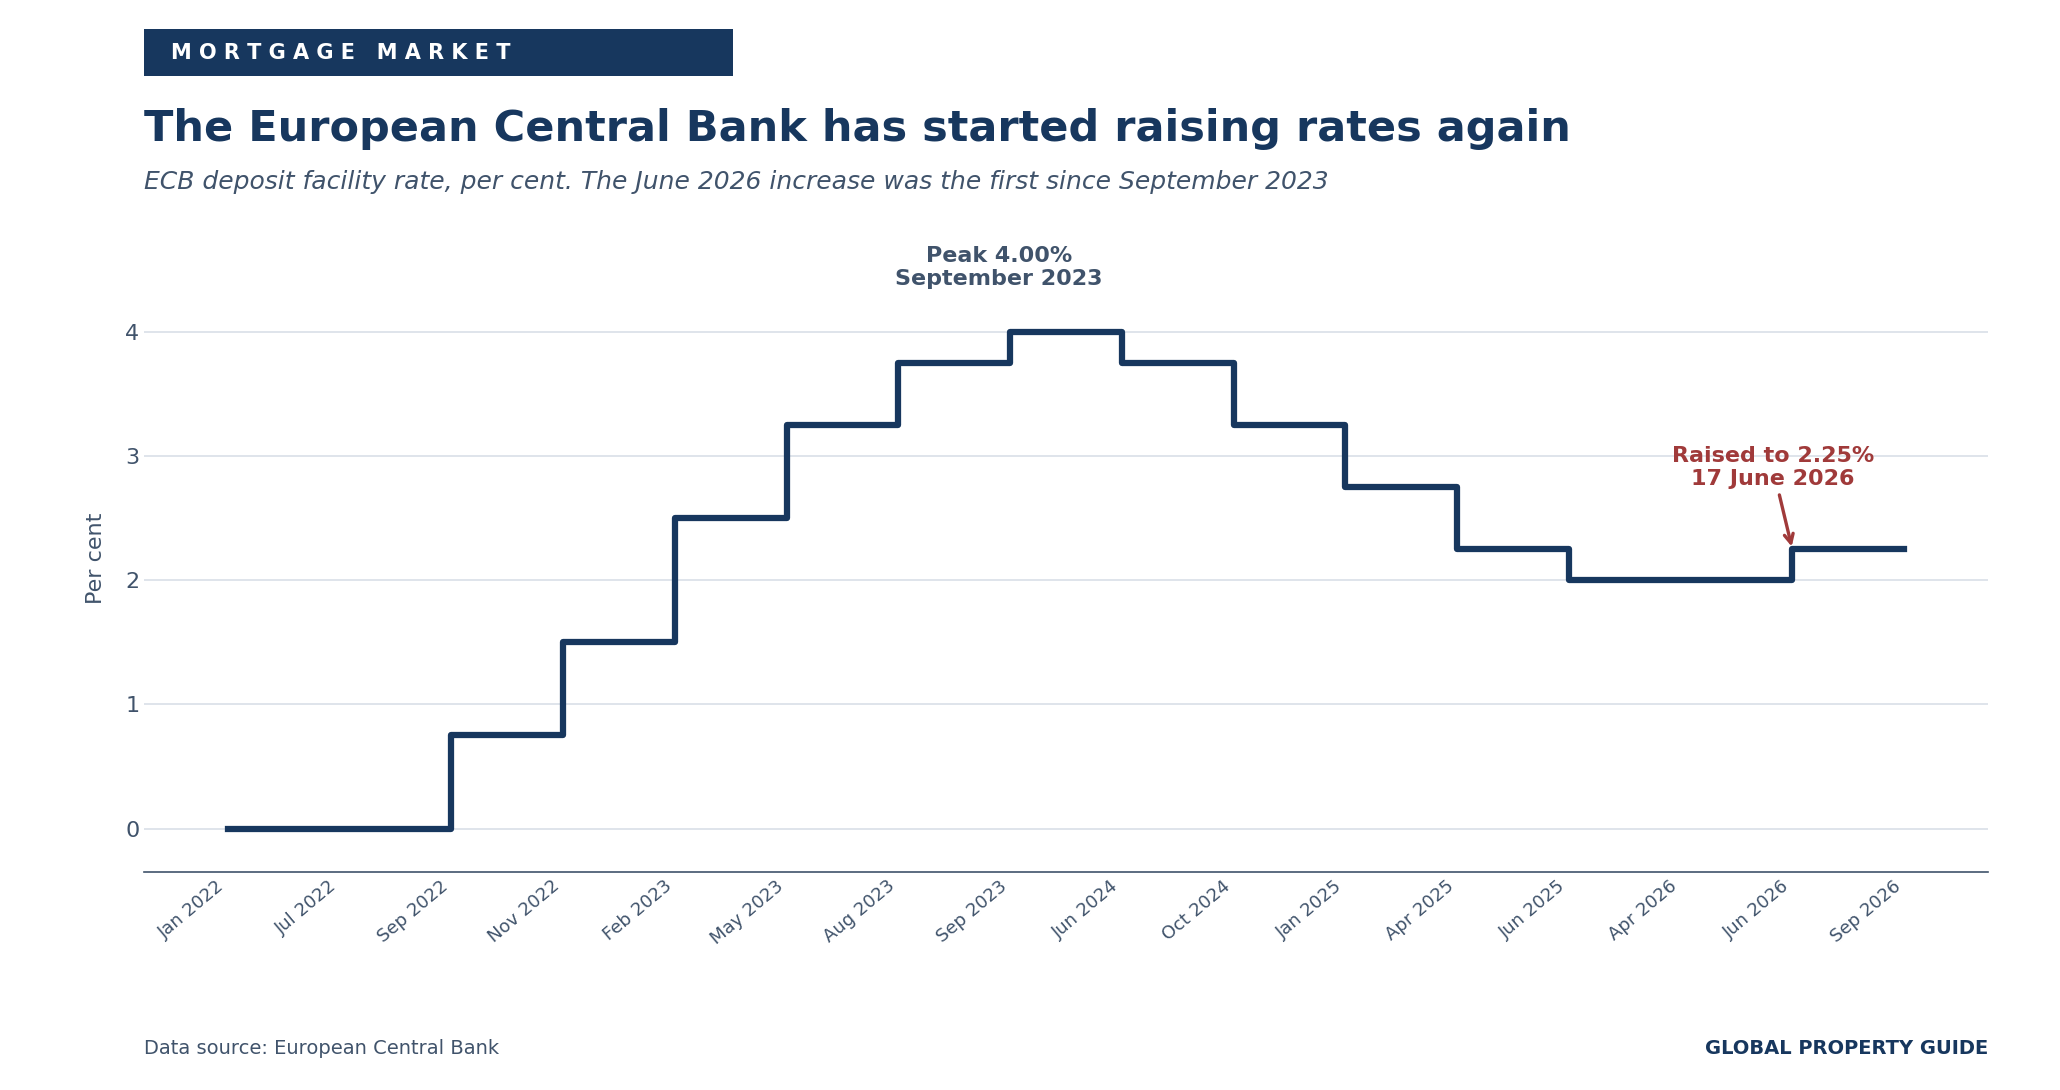
On 11 June 2026, the ECB Governing Council raised its three key interest rates by 25 basis points, taking the deposit facility rate to 2.25%, the main refinancing operations rate to 2.40% and the marginal lending facility to 2.65%, effective 17 June. It was the first increase since September 2023, and it reversed the direction of eight consecutive cuts delivered between June 2024 and June 2025.
Ireland's mortgage loan interest rates:
The trigger was an energy-driven inflation shock. Euro area flash inflation reached 3.2% in May 2026, the highest reading since September 2023, following disruption to energy supply linked to the conflict in the Middle East.
The Governing Council held rates at its July meeting. The published account of that meeting records that the September meeting would provide the next opportunity for a comprehensive assessment of the inflation outlook and surrounding risks, taking into account the evolution of the conflict, and that waiting and reassessing in September represented a reasonable decision. The next decision is due on 10 September 2026.
Irish mortgage rates have fallen below the euro area for the first time since 2023
Domestic pricing has barely responded to the policy turn. According to the Central Bank of Ireland, the weighted average interest rate on new Irish mortgage agreements was 3.49% at the end of June 2026, one basis point above May and eleven basis points below June 2025. Over the same month, the euro area average rose faster, to 3.51%. It was the first time the Irish rate had been below the euro area average since February 2023.
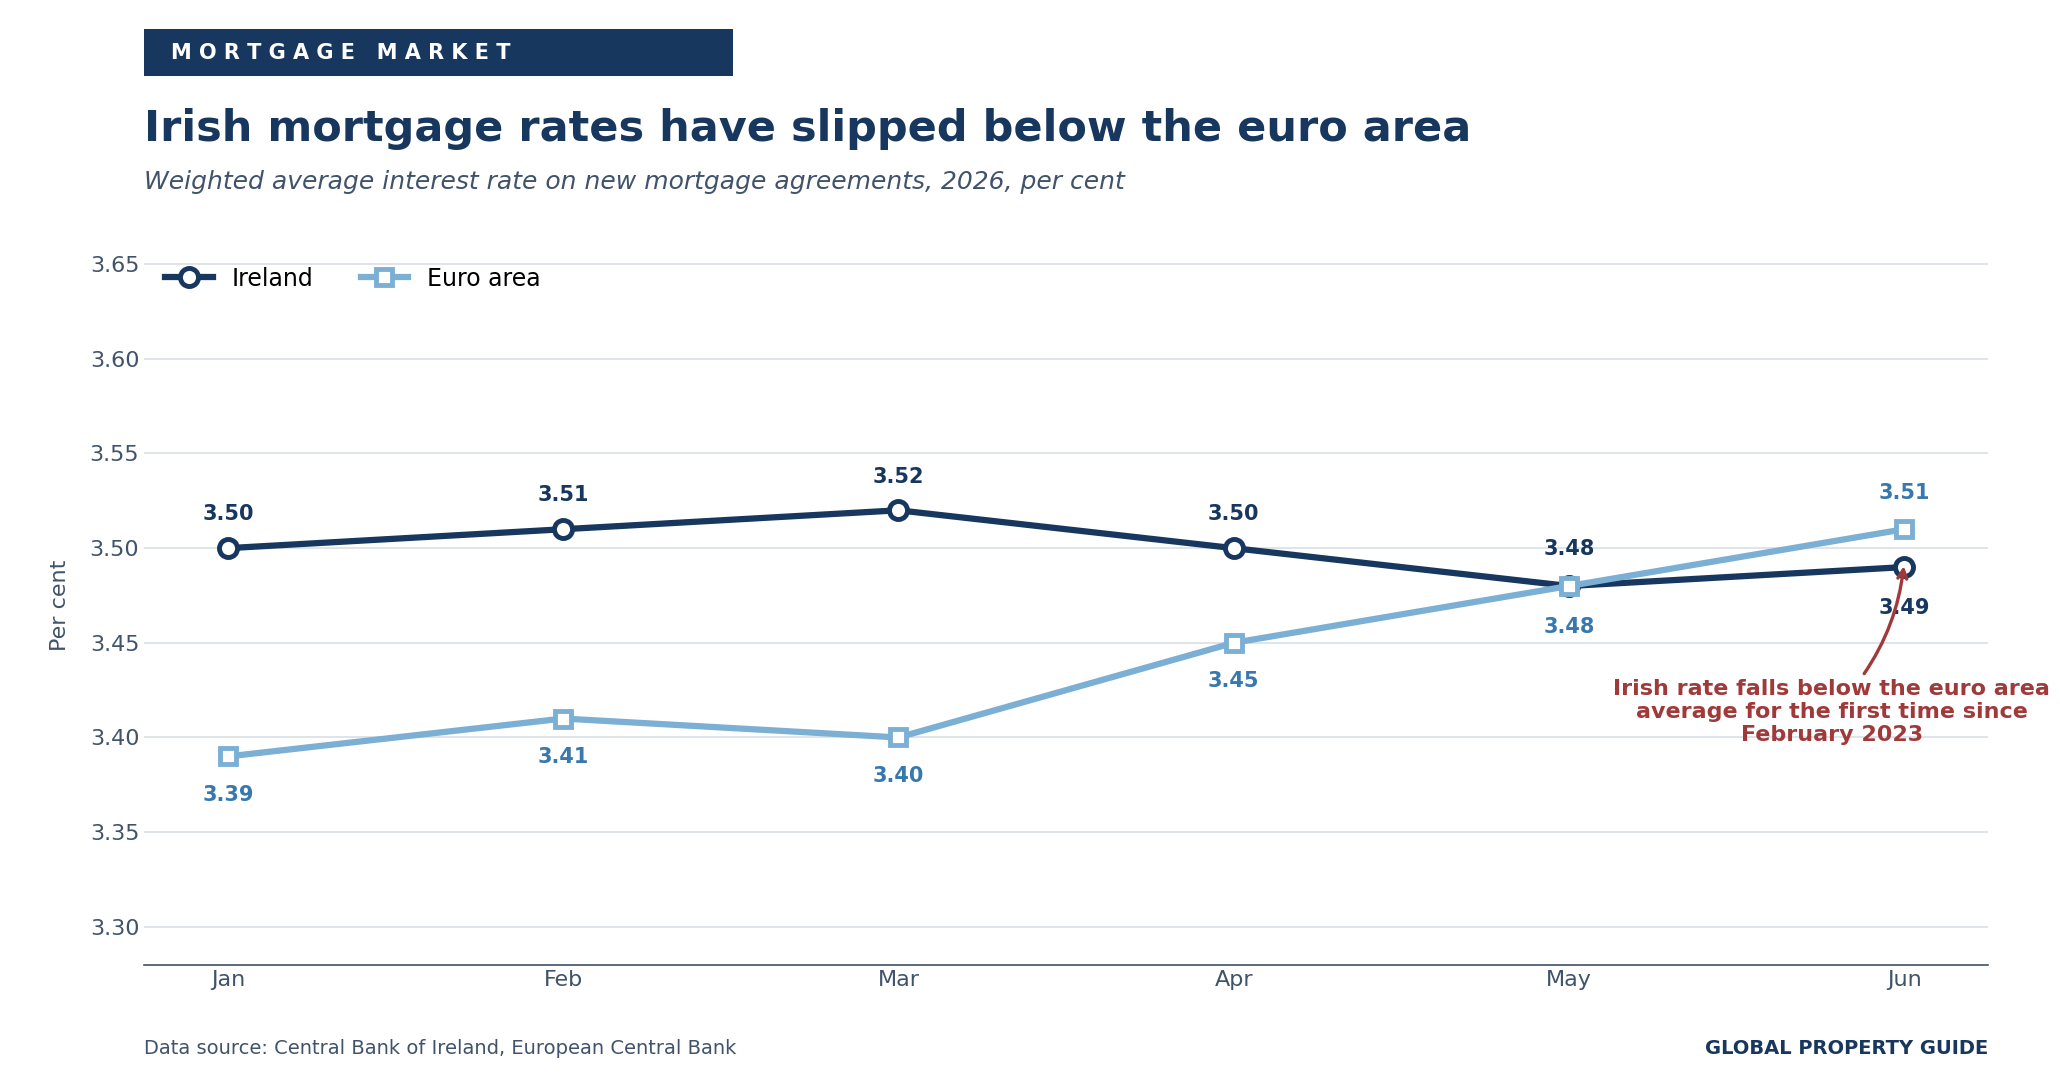
That is a substantial repositioning. In January 2025, the Irish rate stood at 3.82%, 46 basis points above the euro area. Ireland ranked fifth-highest in the currency bloc in February 2025. By June 2026 it had fallen out of the top ten.
Competition rather than policy is doing the work. Trevor Grant, chairman of Irish Mortgage Advisors, told the Irish Times that borrowers should not be unduly alarmed by the widely anticipated September rate rise, adding that most lenders did not move on the back of the June increase, though they may see any September increase as an opportunity to raise rates. Daragh Cassidy of Bonkers.ie noted that AIB, Bank of Ireland and PTSB, which between them account for around 90% of new mortgage lending, had yet to increase their rates.
Borrowers have responded by locking in. Fixed-rate agreements made up 93% of new mortgage lending by volume in May 2026, against 81% in April 2025 and the highest share since February 2023. The average fixed rate stood at 3.44% in May against 4.03% for variable products, a spread of 59 basis points.
Lending volumes reached a record first half
BPFI reported 21,232 mortgage drawdowns worth EUR 6.8 billion (USD 7.88 billion) in the first half of 2026, increases of 5.1% in volume and 9.6% in value. First-time buyer drawdowns reached EUR 4.1 billion (USD 4.75 billion), up 10.5% and the highest half-year value since the series began in 2003.
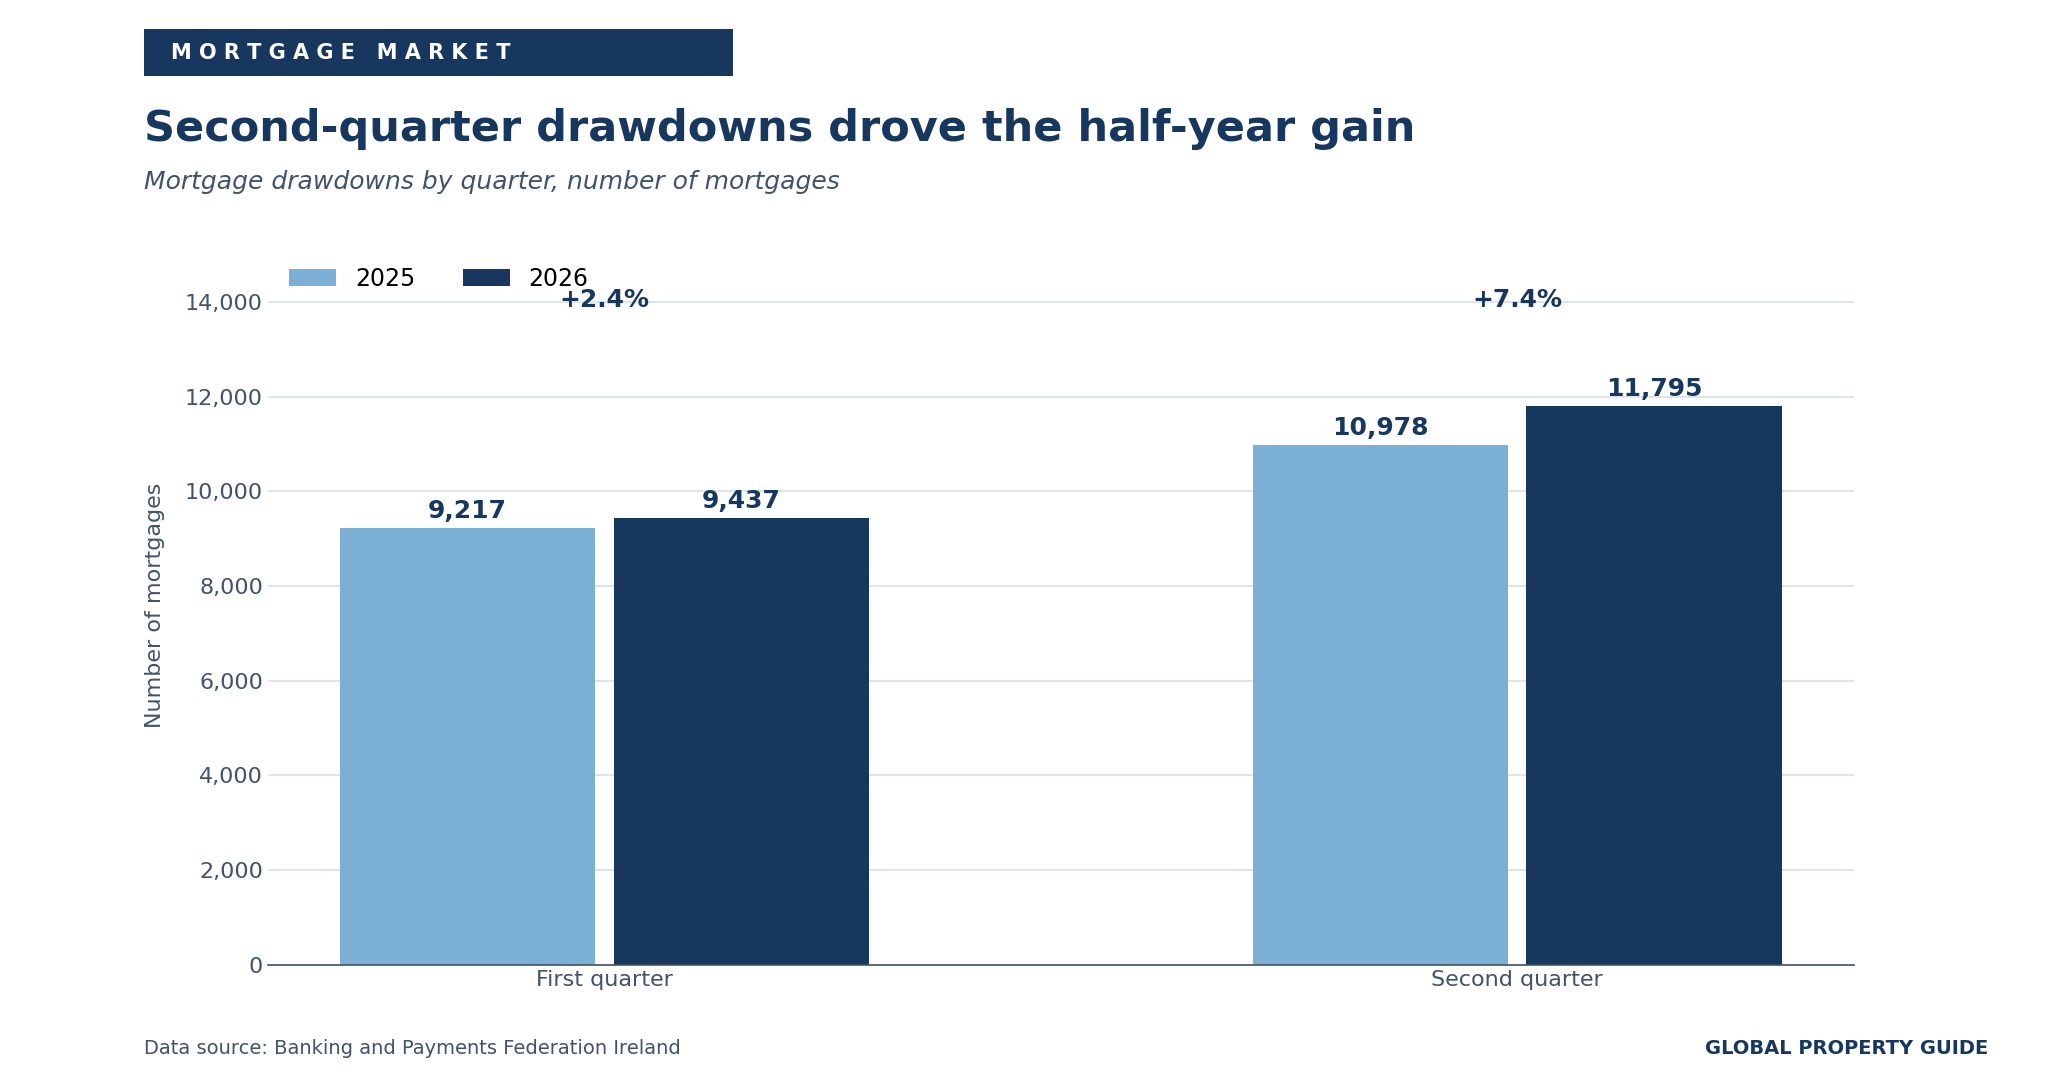
The gain was concentrated in the second quarter, when 11,795 mortgages were drawn down, 7.4% more than in the second quarter of 2025. On an annualised basis, the value of mortgage approvals reached EUR 17.6 billion (USD 20.39 billion) in the twelve months to June 2026, the highest since the approvals series began in 2011.
The volume of pure new mortgage agreements recorded by the Central Bank reached EUR 953 million in May, EUR 10 million above a year earlier. Renegotiations have grown faster, at EUR 461 million in April against EUR 236 million a year earlier, as borrowers move off older fixed terms into cheaper ones.
Economic and Social Factors
Headline growth is swinging, the domestic economy is not
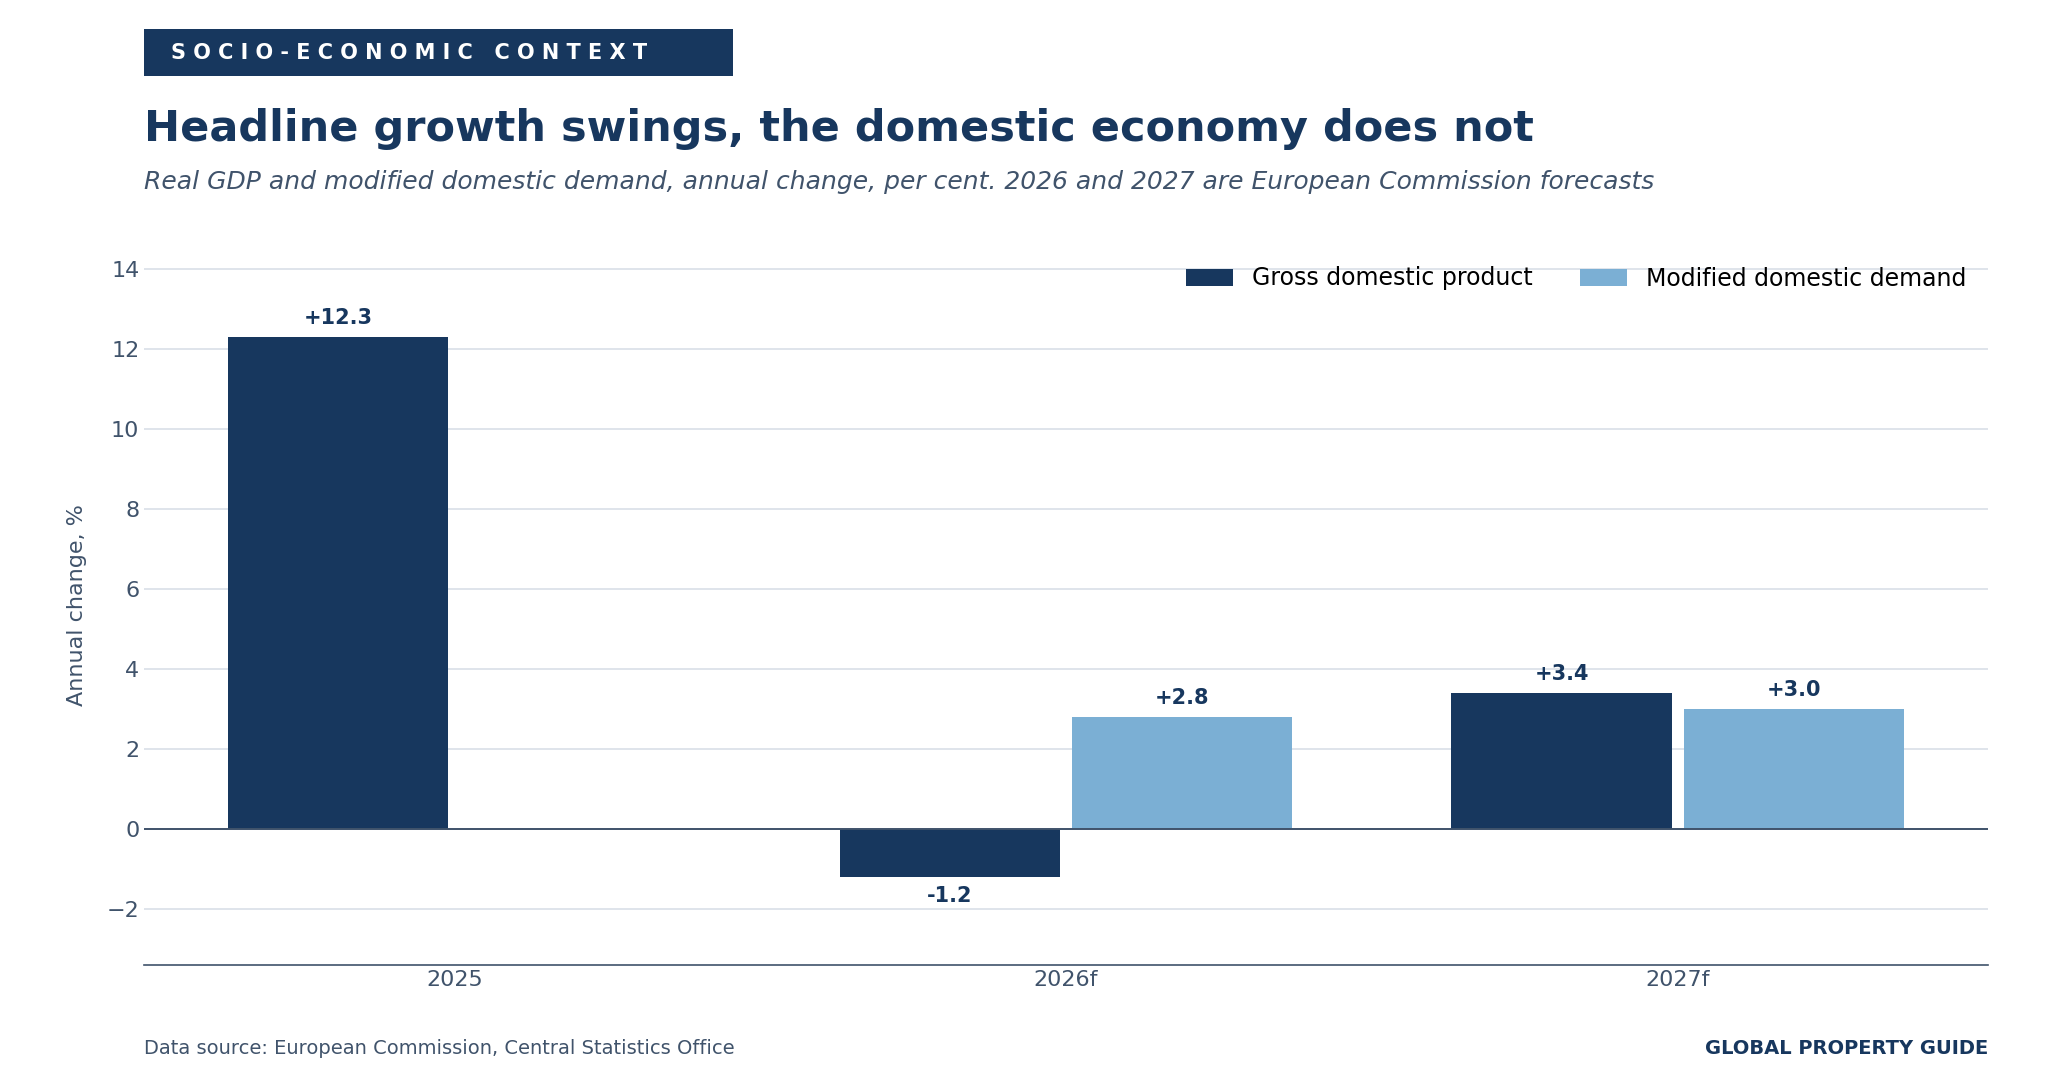
Ireland's national accounts have become difficult to read. Real GDP grew 12.3% in 2025, driven overwhelmingly by pharmaceutical exports front-loaded ahead of anticipated US tariffs. As that effect unwinds, the European Commission's spring 2026 forecast projects GDP contracting by 1.2% in 2026 before growing 3.4% in 2027. GDP fell 12.1% year on year in the first quarter of 2026.
Modified domestic demand, which strips out the distortions, is the more useful measure. The Commission expects it to expand 2.8% in 2026 and 3.0% in 2027. The Economic and Social Research Institute's summer commentary forecasts 2.6% and 2.8%, an upgrade from its spring projection driven by modified investment.
Inflation has doubled, which matters directly for housing
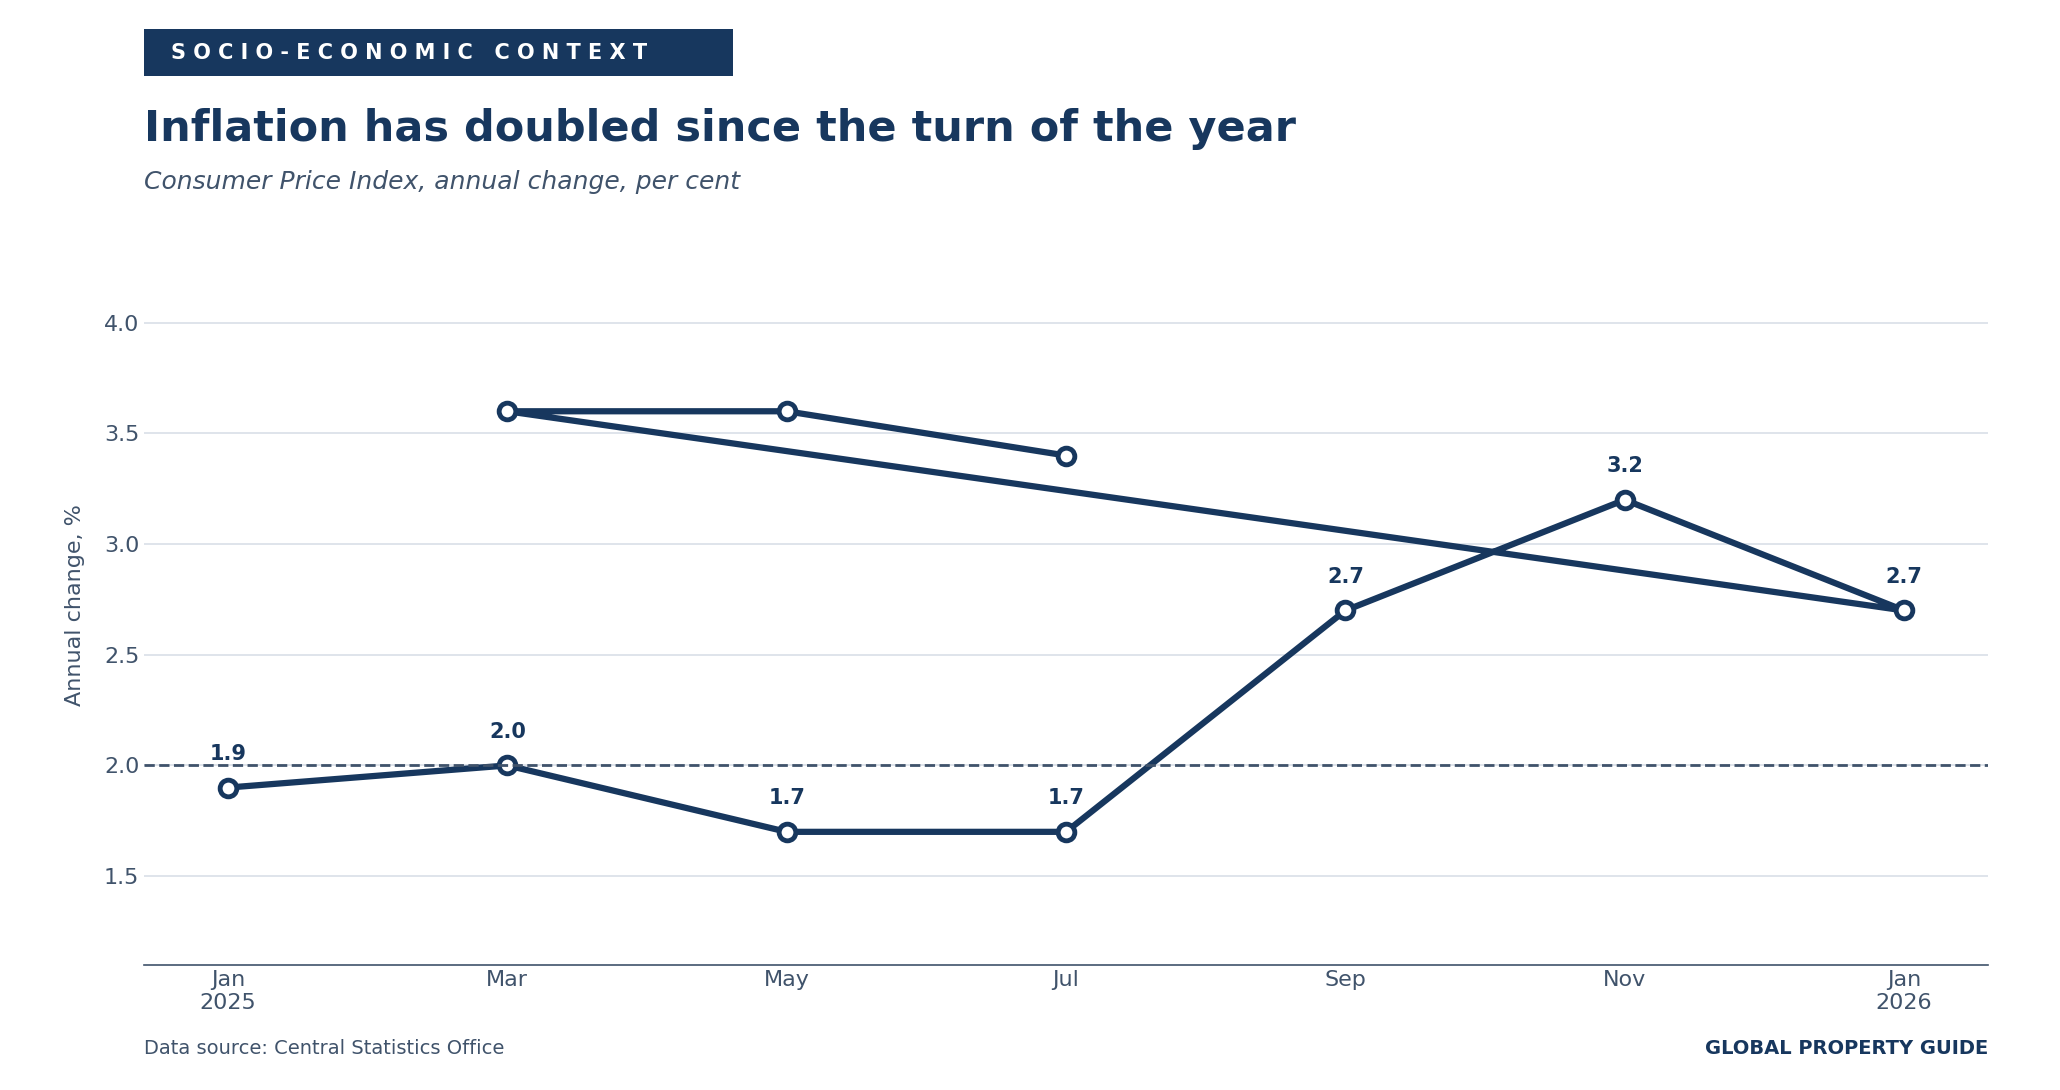
Consumer price inflation reached 3.4% in the year to July 2026, unchanged from June and up from 2.7% in February. The Commission forecasts 3.5% for 2026 as a whole, falling to 2.6% in 2027; the ESRI forecasts 3.7% and 3.1%. Both are substantially above the sub-2% path expected when the previous edition of this report was written.
Housing is the largest single contributor. The Housing, Water, Electricity, Gas and Other Fuels division rose 7.7% over the year and contributed 1.20 percentage points to headline inflation, more than any other division. In July 2026, no division recorded an annual decline, the first time that has happened since December 2021.
The labour market has begun to soften
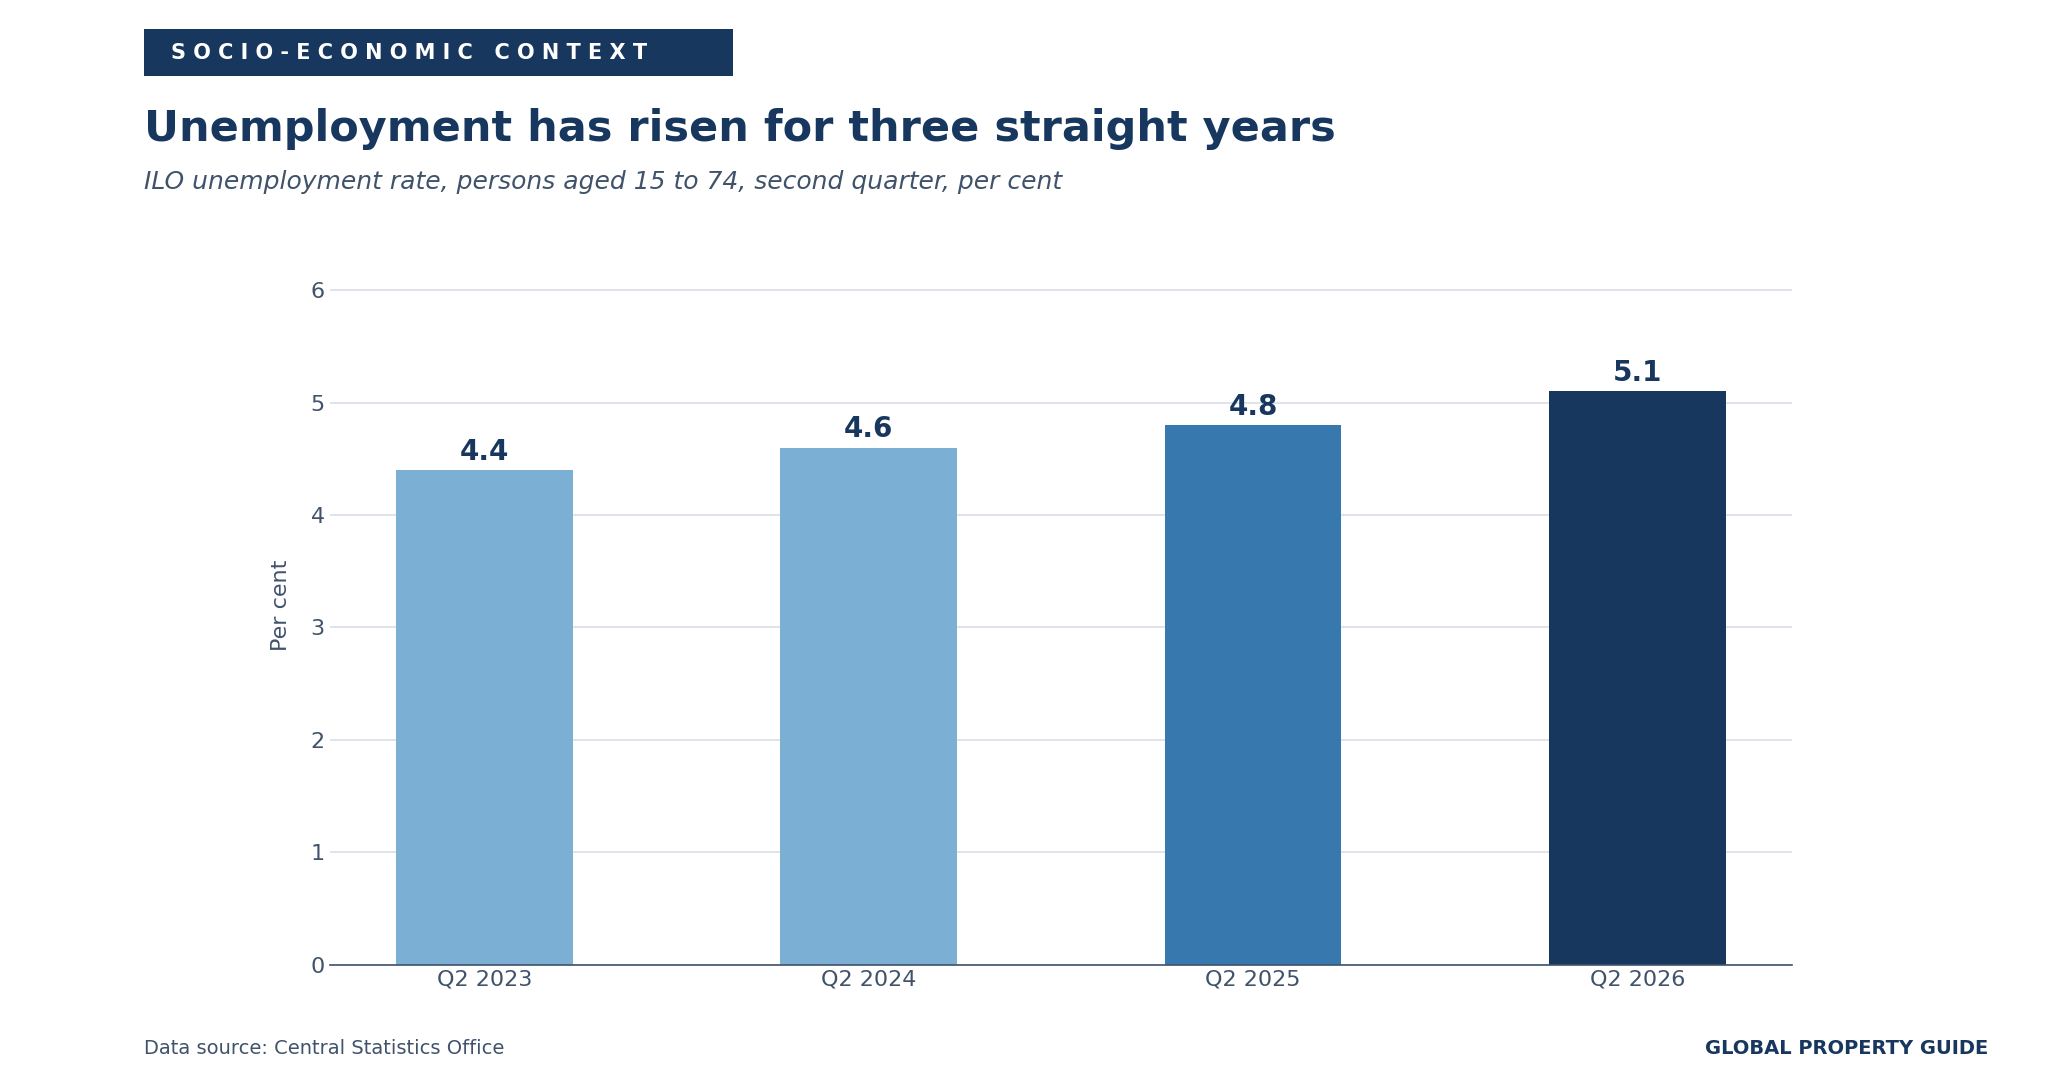
The CSO's Labour Force Survey recorded 2.84 million people in employment in the second quarter of 2026, the highest level ever recorded and 0.8% above a year earlier. Beneath that record, the direction has turned. The employment rate for those aged 15 to 64 fell to 74.3% from 74.7%, and from a peak of 75.3% in the third quarter of 2024. The unemployment rate rose to 5.1% from 4.8%, with the number unemployed up 7.2% to 151,000.
Youth unemployment stood at 13.2% against 4.2% for those aged 25 to 74. Construction employment, relevant to the supply outlook, rose to 195,600 in the first quarter of 2026 from 177,800 a year earlier.
The Commission notes that the outlook for public finances is positive but marked by significant risks to corporation tax revenues. The exposure is the familiar one: a small open economy with extensive trade and investment links to the United States, where a handful of multinational sectors drive both the export numbers and the tax base.
For housing specifically, the more immediate risk is domestic. Rent inflation is running at nearly twice the headline rate, mortgage interest costs are up 10% year on year, and the ECB may raise rates again within days of this report's publication. Affordability pressure is building from several directions at once, even as the supply response finally arrives.
Sources:
- The Government of Ireland
- Delivering Homes, Building Communities 2025-2030: https://www.gov.ie/
- Economic Insights, Volume 3 2025: https://assets.gov.ie/
- Commencement Data for December 2025: https://www.gov.ie/
- Minister Browne Marks Strong Momentum in New Home Commencements for the First Half of 2026: https://www.gov.ie/
- Residential Commencement Notices, monthly dataset: https://opendata.housing.gov.ie/
- Central Statistics Office (CSO)
- Residential Property Price Index June 2026: https://www.cso.ie/
- New Dwelling Completions Q2 2026: https://www.cso.ie/
- Consumer Price Index July 2026: https://www.cso.ie/
- Labour Force Survey Quarter 1 2026: https://www.cso.ie/
- Press Statement, Highlights from the Housing Hub May 2026: https://www.cso.ie/
- Central Bank of Ireland
- Retail Interest Rates: https://www.centralbank.ie/
- Retail Interest Rates, January 2026 statistical release: https://www.centralbank.ie/
- Mortgage Measures: https://www.centralbank.ie/
- European Central Bank (ECB)
- Monetary Policy Decisions, 11 June 2026: https://www.ecb.europa.eu/
- Monetary Policy Decisions, 30 April 2026: https://www.ecb.europa.eu/
- Account of the Monetary Policy Meeting of 22 and 23 July 2026: https://www.ecb.europa.eu/
- Euro Area Bank Interest Rate Statistics, May 2026: https://www.ecb.europa.eu/
- European Commission
- Economic Forecast for Ireland: https://economy-finance.ec.europa.eu/
- Banking and Payments Federation Ireland (BPFI)
- Mortgage Drawdowns Report Q1 2026: https://bpfi.ie/
- Mortgage Drawdowns Report Q4 2025: https://bpfi.ie/
- Economic and Social Research Institute (ESRI)
- Quarterly Economic Commentary, Summer 2026: https://www.esri.ie/
- Housing Agency
- Review of Rent Pressure Zones and Consideration of Potential Policy Options: https://www.housingagency.ie/
- Bank of Ireland
- Ireland Outlook, April 2026: https://corporate-economy.bankofireland.com/
- Global Property Guide
- Gross Rental Yields in Ireland: https://www.globalpropertyguide.com/
- RTE
- House Prices in Dublin Falling, Rural Prices Rise: https://www.rte.ie/
- Sharp Increase in Rent Prices as New Rules Take Effect: https://www.rte.ie/
- Rate of Monthly Rent Rises Slowed in Q2: https://www.rte.ie/
- Building of Over 3,000 Homes Commenced in July: https://www.rte.ie/
- Mortgage Lending Continues to Rise: https://www.rte.ie/
- Numbers at Work Up by 0.8% to 2.8 Million in Q2: https://www.rte.ie/
- The Irish Times
- Mortgage Interest Rates Up Slightly but Dip Below Euro Zone Average: https://www.irishtimes.com/
- First-Time Buyer Mortgage Drawdowns Back to Celtic Tiger Levels: https://www.irishtimes.com/
- Average Cost of Irish Mortgage Drops to Just Above Euro Area Average: https://www.irishtimes.com/
- The Irish Examiner
- First-Time-Buyer Mortgage Drawdowns Reach 20-Year High: https://www.irishexaminer.com/
- Irish Mortgage Rates Drop to Euro Area Average for the First Time in Three Years: https://www.irishexaminer.com/
- The Law Society Gazette
- FTB Mortgage Values Hit Record in H1: https://www.lawsociety.ie/