Ireland’s housing market has lost steam
Ireland’s house price growth is now slowing sharply, with restrictive lending rules from the central bank, coupled with increasing housing supply. The uncertainty surrounding Brexit is also making homebuyers cautious.
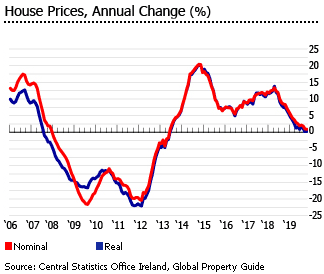
The national residential property price index rose by a minuscule 0.93% (0.24% inflation-adjusted) during the year to October 2019, sharply down from last year’s 8.34% y-o-y rise, according to the Central Statistics Office (CSO) Ireland. It was the lowest growth recorded since May 2013 when house prices declined 1.67%.
This is supported by figures from Ireland’s largest property website Daft.ie, which saw nationwide average house prices rising only marginally (by 0.1%) during the year to Q3 2019, to €257,114 (US$286,528).
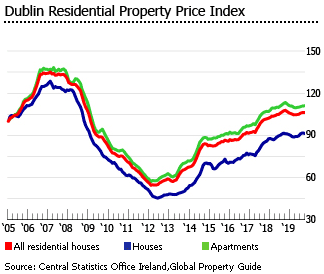
Nationally, residential property prices are up 56.5% from the lowest post-crash point in Q3 2013.
In Dublin, Ireland’s capital city, the residential property price index was down by 1.48% (-2.16% inflation-adjusted) during the year to October 2019, in contrast to a 6.31% y-o-y rise in October 2018, according to the CSO. This is not surprising given that Dublin has recently seen a large increase in residential construction.
During the year to Q3 2019:
- In Dublin City Centre, the average asking price fell by 2.4% to €328,551 (US$365,924), in stark contrast to a 9.9% y-o-y increase the previous year.
- North Dublin City’s average asking price rose by a meagre 0.1% y-o-y to €344,113 (US$383,256), a sharp slowdown from a 5% annual rise in Q3 2018.
- North County Dublin’s average asking price rose slightly by 0.3% y-o-y to €316,261 (US$352,236), a slowdown from an annual rise of 3.9% a year earlier.
- South Dublin City’s average asking price fell by 0.3% y-o-y to €411,098 (US$457,860), in contrast to a 6.1% growth a year earlier.
- West County Dublin’s average asking price dropped slightly by 0.1% y-o-y to €305,980 (US$340,785), a slowdown from a 2.2% growth a year ago.
- South County Dublin’s average asking price fell by 3.6% y-o-y to €580,971 (US$647,056), a sharp turnaround from a y-o-y growth of 7.9% a year earlier.
Outside Dublin, average residential prices rose by a modest 3.3% (2.59% inflation-adjusted) during the year to October 2019, far lower than the previous year’s 10.62% growth, according to the CSO Ireland.
In some of Ireland’s biggest cities (based on Daft.ie’s figures):
- In Cork, Ireland’s second largest city (located in Munster, in Ireland’s south), the average asking price rose by 2.8% y-o-y to €281,251 (US$313,243) in Q3 2019, lower than the previous year’s 5.1% growth.
- In Limerick City, Ireland’s third most populous city, the average asking price rose by 5.5% y-o-y to €201,865 (US$224,827) in Q3 2019, a slowdown from a 7.6% growth in Q3 2018.
- In Galway, one of the country’s biggest cities and known as the “cultural heart of Ireland” (located in Connacht, Ireland’s western region), the average asking price fell slightly by 0.3% y-o-y to €198,850 (US$221,469) in Q3 2019, in contrast to a 6.7% y-o-y rise in the same period last year.
- In Waterford City, also one of Ireland’s bigger cities, the average asking price increased 4.7% y-o-y to €181,395 (US$202,029) in Q3 2019, a slowdown from an 8.3% growth a year ago.
Apartment prices in Ireland rose by a meagre 0.56% during the year to October 2019 (-0.13% inflation-adjusted), a sharp slowdown from a 9.74% growth a year earlier. Likewise, house prices increased by just 0.81% (0.12% inflation-adjusted), down from the previous year’s 8.57% y-o-y rise.
ANNUAL HOUSE PRICE CHANGE, OCTOBER 2019 |
||||||
| Houses | Apartments | All Residential | ||||
| Nominal | Real | Nominal | Real | Nominal | Real | |
| Ireland | 0.81 | 0.12 | 0.56 | -0.13 | 0.93 | 0.24 |
| Dublin | -1.94 | -2.61 | 0.11 | -0.58 | -1.48 | -2.16 |
| Rest of Ireland | 3.25 | 2.54 | - | - | 3.30 | 2.59 |
| Source: Central Statistics Office Ireland | ||||||
“The current slowdown in price inflation is largely due to the Central Bank’s lending rules and stretched affordability,”said Conall MacCoille, chief economist at Davy, Ireland’s largest stockbroker. “These factors are preventing the latent housing demand from translating into rampant house price inflation fuelled by rising leverage on mortgage loans.”
Recently, Davy revised down its house price growth forecast for Ireland to just 1% this year and to 2% in 2020.
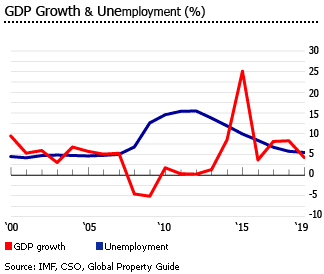
Ireland’s economy is expected to grow by 5.6% this year and by another 3.5% in 2020, after expansions of 8.3% in 2018, 8.1% in 2017, 3.7% in 2016, and 25.1% in 2014 (obviously a statistical artefact), based on the European Commission estimates.
Ireland's housing market has been highly cyclical
From 1996 to 2006 Ireland experienced a massive house price boom, with average used home prices up 383%, and new house prices up 284% - one of Europe's longest and biggest booms.
When the bubble burst in 2008, it was Europe’s biggest property bust. The downturn began in 2006 and 2007, when interest rate hikes left many borrowers in difficulty. The 2006-2007 U.S. subprime mortgage crisis added to the downturn.
Ireland’s house prices fell by an average of 53% from the peak, compared to the typical OECD fall of 23%. House prices plummeted by 12.4% (-13.4% inflation-adjusted) in 2008, followed by declines of 18.6% (-14.3% inflation-adjusted) in 2009, 10.5% (-11.6% inflation-adjusted) in 2010, and 16.7% (-18.7% inflation-adjusted in 2011. In 2012, house prices dropped by another 4.5% (-5.7% inflation-adjusted) from a year earlier.
The Irish housing market started to recover in 2013, with house prices rising by 6.4% (6.2% inflation-adjusted). The dramatic house price surge in 2014 of 16.3% (16.6% inflation-adjusted) was mainly due to the recovery of the Irish economy, which expanded by 8.7% in 2014, up from growth of only 1.3% in 2013 and 0.2% in 2012.
In an attempt to prevent another housing bubble from happening, the central bank implemented new rules in January 2015, which limited loan-to-value ratios on houses priced over €220,000 and on 2nd purchases to 80%, and 70% on buy-to-let purchases. Loans for private dwelling homes were also limited to 3.5 times gross income.
Despite this, house prices continued to increase strongly, supported by resilient demand as well as supply shortages. House prices increased 7.1% (7% inflation-adjusted) in 2015, by 9% (9% inflation-adjusted) in 2016 and by another 12.1% (11.7% inflation-adjusted) in 2017.
The housing market started to slow last year, amidst a surge in homebuilding, coupled with lending restrictions and the uncertainty about Brexit. House prices rose by 6.25% in 2018 (5.51% inflation-adjusted) – the lowest growth since 2012.
Housing completions surging - but permits steady
Dwelling completions rose strongly by 13.3% during the first three quarters of 2019, as compared to the same period last year, according to the CSO. On the other hand, dwelling permits were almost steady at 7,730 units over the same period, according to the Department of Housing, Planning and Local Government.
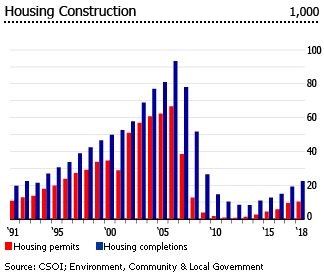
During the boom, completions tripled to 93,000 units in 2006, up from 30,000 units in 1995. However, by 2011 completions had fallen to only 10,480 units. The decline continued for two more years, with only 8,488 dwelling completions in 2012, and 8,301 units in 2013.
Completions rose by 32.7% to 11,016 units in 2014, by 15% to 12,666 units in 2015, by 17.9% to 14,932 units in 2016, by 28.5% to 19,185 units in 2017, and by another 16.7% to 22,385 units in 2018. The country’s total housing stock was more than 2 million units last year.
Demand growth slowing
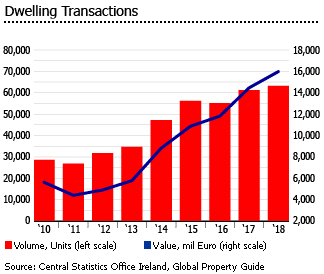
Demand growth has noticeably slowed this year. During the first ten months of 2019, the value of residential property transactions in Ireland rose by a modest 2.2% y-o-y to about €13 billion (US$14.5 billion). And the number of transactions increased by a minuscule 0.7% to 49,839 units over the same period.
The previous seven years saw demand continuously rise. In 2018, the value of residential property transactions in Ireland rose by 11.7% to €16.05 billion (US$17.91 billion), after y-o-y increases of 19.7% in 2017, 13.9% in 2016, 15.5% in 2015, 57.4% in 2014, 19.1% in 2013, and 24.4% in 2012, according to the CSO.
During the first ten months of 2019:
- In Dublin, which accounts for more than half of all transactions, the total transaction value fell by 3.5% y-o-y to €6.5 billion (US$7.25 billion).
- In Cork County, the total transaction value rose by 12.82% y-o-y to €1.27 billion (US$1.42 billion).
- In Galway County, the total transaction value rose by 3.44% y-o-y to €475.6 million (US$530.63 million).
- In Waterford City, the total transaction value rose by 1.95% y-o-y to €213.9 million (US$238.65 million).
- In Limerick City, the total transaction value rose by 2.53% y-o-y to €331.7 million (US$370.08 million).
Interest rates continue to fall
Mortgage interest rates in Ireland remain very low, fueling strong housing demand. In October 2019:
- The average interest rate for housing loans with maturity of up to 1 year was 3.1%, down from 3.63% in the same period last year.
- The average interest rate for housing loans with maturity of between 1 and 5 years was 3.24%, down from 3.33% a year ago.
- The average interest rate for housing loans with maturity of over 5 years was 2.52%, unchanged from a year earlier.
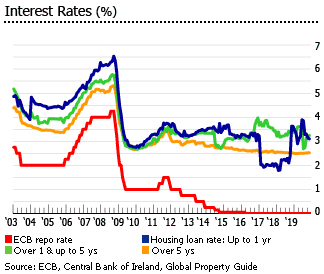
The European Central Bank (ECB)’s refinancing rate remained at zero in November 2019, unchanged since March 2016.
Central bank’s lending cap has restrained price rises
On January 27, 2015, the central bank introduced new regulations to limit mortgage lending. A central bank review in December 2019 found the measures have kept house prices from rising significantly, so they will stay unchanged in 2020.
These measures include the following:
- Loan to Value (LTV) limits for principal dwelling houses (PDH):
- 90% LTV limit on PDH mortgages of first time buyers
- 80% LTV limit on PDH mortgages of second and subsequent buyers
- Banks and other lenders have the freedom to lend a certain amount above these limits: Up to 5% of the value of mortgages to first time buyers and up to 20% to second and subsequent buyers
- LTV for Buy to Let mortgages (BLTs):
- 70% LTV limit on BTL mortgages
- Banks can lend above these limits, but onlyup to 10% of the value of all non PDH mortgages on an annual basis
- Loan to Income (LTI) for PDH mortgages:
- A limit of 3.5 times loan to gross income on PDH mortgage loans
- Banks can lend above the said limit:up to 20% of the value of new mortgages to first time buyers can be above the LTI cap; and up to 10% of the value of new mortgages to second and subsequent buyers can be above the LTI cap.
“Growth in new mortgage lending, housing market activity and in house prices has continued but at a slower pace,” said the central bank. “Over the course of the year, the supply of new housing has also continued to grow. The supply response to date has been strongest in areas where house prices are higher and it is these areas where the measures are also more binding.”
According to the central bank, these measures are now a permanent feature of Ireland’s mortgage market. They raise bank and borrower resilience and ensure that the financial system can better withstand future economic shocks.
Mortgage market continues to shrink
Due to the central bank’s measures Ireland’s mortgage market is shrinking. Residential mortgage lending fell to just 23.5% of GDP in 2018, from 25.1% in 2017, 27% in 2016, 29.2% in 2015, 40.1% in 2014 and 46.2% in 2013. It is now way below the peak of 64.5% of GDP in 2009.
In 2019, the size of the mortgage market is expected to contract further to about 22.2% of GDP.
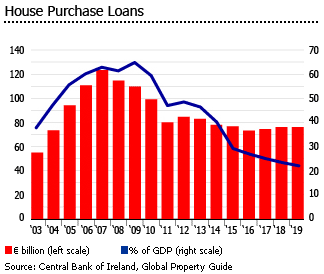
Loans outstanding for house purchase fell by 1.7% y-o-y to €76.02 billion (US$84.71 billion) in October 2019, according to the Central Bank of Ireland.
New housing loans with floating rate and up to one-year fixation fell by 21% y-o-y €282 million (US$314.3 million) in October 2019. In contrast, new housing loans with over one-year fixation rose modestly by 3.6% to €770 million (US$858.1 million) over the same period.
Rent increases slowing, amidst improving availability
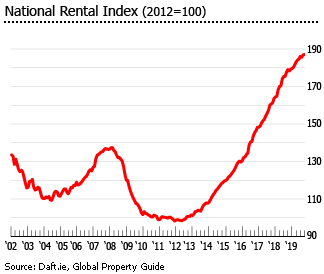
Ireland’s rent index rose by 5.2% during the year to Q3 2019 to an average monthly rent of €1,403 (US$1,565), a sharp slowdown from last year’s 11.3% y-o-y growth, according to Daft.ie’s Rental Price Report Q3 2019. Rents are still rising in all of the 54 markets covered by Daft.ie, but the number of markets where rent rises are greater than 10%, year-on-year, has fallen to just 5, compared to 41 of 54 markets a year earlier.
Quarter-on-quarter, rents rose by a meagre 0.9% during the latest quarter – the smallest rise in over six years.
The average nationwide rent has now risen by about 90% since bottoming out in late 2011. In fact, rents are already 36% higher than at the 2008 peak.
In the country’s capital Dublin, rents rose by a modest 3.9% during the year to Q3 2019 – a sharp slowdown from the previous year’s 10.9% growth and the slowest rise in 7 years.
- In Dublin City Centre, the average rent was €2,083 (US$2,324), up by 3.4% during the year to Q3 2019.
- In South County Dublin, the average rent increased 3.1% y-o-y to €2,224 (US$2,481).
- In South Dublin City, the average rent rose by 3.4% y-o-y to €2,166 (US$2,417).
- In West County Dublin, the average rent was up by 4% y-o-y to €1,816 (US$2,026).
- In North County Dublin, the average rent rose by 5.6% y-o-y to €1,728 (US$1,928).
- In North Dublin City, the average rent increased by 4.9% y-o-y to €1,937 (US$2,161).
Outside Dublin:
- In Cork City, average rents were up by 5.5% y-o-y to €1,372 (US$1,531).
- In Galway City, average rents rose by 5.9% y-o-y to €1,299 (US$1,449).
- In Limerick City, average rents increased by 5.9% y-o-y to €1,219 (US$1,360).
- In Waterford City, average rents rose by 5.5% y-o-y to €1,007 (US$1,124).
The slowing rent growth can be attributed to increasing supply. In October 2019, there were about 3,500 homes available to rent nationwide, up 10% from a year earlier, according to Daft.ie, and there was a similar increase in Dublin.
The 2008 housing crash initially resulted in a huge expansion of the number of rental properties on the market, which rose dramatically to more than 23,400 in August 2009, from only 6,200 units in August 2007. However supply has not kept with demand. It was only last year that residential construction remarkably increased again.
“Only in the last year has availability on the rental market improved from all-time lows,” said Ronan Lyons of Daft.ie. “And only in the last year has rental inflation started to ease off. The two are not a coincidence. A remarkably strong predictor of what will happen rents over the coming three months than how many homes are on the market now.”
Excellent yields on small apartments in Dublin
Gross rental yields on apartments remain excellent in Ireland, in certain areas and for certain sizes. But in general, smaller units earn higher returns.
In Q3 2019, nationwide gross rental yields range from as high as 9.8% for one-bedroom apartments and 4.3% for four- to five-bedroom apartments, according to Daft.ie.
In Dublin centre, gross rental yields range from 2.8% to 13% in Q3 2019, according to Daft.ie. One-bedroom apartments earn yields of 6.4% to 13% while five-bedroom houses offer yields of just 2.8% to 5.6%. Dublin 17 has the highest rental yields nationwide, followed by Dublin 22, 10, 24, and 11.
In other areas:
- West County Dublin gross rental yields range from 4.6% to 10.7% in Q3 2019.
- North County Dublin yields range from 4.3% to 9.9%.
- South County Dublin yields range from 3.1% to 7.3%.
- Cork City yields range from 3.8% to 10.4%.
- Galway City yields range from 3.6% to 9.9%.
- Limerick City gross rental yields range from 4.4% to 12.1%.
- Waterford City gross rental yields range from 4.2% to 11.6%.
Tax inversions artificially inflate Ireland’s economic growth
Ireland’s stellar economic growth for 2018 has confounded expectations again, with official estimates showing that real GDP expanded by 8.3% from a year earlier. This was mainly driven by companies nominally relocating in the country, such as Perrigo Co. and Jazz Pharmaceuticals Plc. They are attracted by the country’s very open economy and by its relatively low tax inversion rate of 12.5%. These corporate inversions result in little real change in output, just a change in where the legal ownership of the output is located.
When a corporation’s headquarters become resident in Ireland, all of its profits (including profits generated abroad) are counted as part of the country’s gross national income - which dramatically increases the country’s economic growth without corresponding increases in employment. Also, this increases Ireland’s contribution to the EU budget, which is based on the size of a member’s economy. The also create confusion about the real condition of the Irish economy, and increase people’s skepticism with regards to the reliability of economic figures.
Nobel Prize award-winning economist Paul Krugman described a similar phenomenon as "Leprechaun economics".
The Irish economy grew by 8.1% in 2017, after GDP growth of 3.7% in 2016, 25.1% in 2014 (obviously a statistical artefact), 8.5% in 2014, and 1.4% in 2013, according to the International Monetary Fund (IMF). The economy is expected to expand by a more modest 5.6% this year and 3.5% in 2020, based on the European Commission estimates.
Overall inflation was 1.1% in November 2019, up from 0.6% in the same period last year, according to CSO. Nationwide inflation rate was estimated at 0.5% last year, an acceleration from 0.4% in 2017, 0% in 2016, -0.3% in 2015, and 0.2% in 2014.
Unemployment dropped to 4.8% in November 2019, down from 5.6% a year earlier, according to the CSO. This is also substantially lower than the 12.1% average unemployment from 2009 to 2017, but still higher than the average of 4.4% between 2000 and 2007.
There were about 117,800 unemployed persons in November 2019 – a decrease of 17,600 from a year earlier.
Ireland posts first budget surplus in 11 years
Ireland’s economy has been on an unusual journey over the past 7 years.
Ireland had the euro zone’s highest budget deficit in 2010, at 31.2% of GDP. In November 2010 it had no choice but to seek a €67.5 billion (US$82 billion) bailout from the European Union (EU) and the International Monetary Fund (IMF). In exchange, Ireland committed to a harsh austerity program.
The country spent around €80 billion to establish the National Asset Management Agency (NAMA) to buy toxic loans, primarily to improve the availability of credit to the Irish economy, and to remove non-performing loans from bank balance sheets.
In June 2012, 60.29% of Irish voters agreed to the European fiscal compact of May 31, 2012, allowing Ireland to access to the European Stability Mechanism, a €500 billion (US$618 billion) bailout fund.
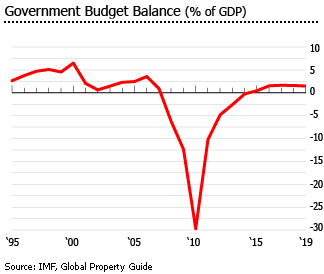
By 2011 the Irish budget deficit had fallen to 12.5%, and to 8% in 2012, comfortably within the 8.6% target set by Ireland’s international creditors: the EU, ECB and IMF. The budget deficit declined again to 5.7% of GDP in 2013. At end-2013 Ireland became the first country to exit the eurozone bailout programme.
In 2018, Ireland recorded a budget surplus equivalent to 0.1% of GDP, from deficits of 0.3% of GDP in 2017, 0.7% in 2016, 1.9% in 2015, and 3.6% in 2014, amidst strong economic growth and robust corporation tax payments. It was the first surplus since 2007.
The country is expected to post surpluses equal to 0.2% of GDP this year, and 0.3% of GDP in 2020, according to the European Commission.
Likewise, gross public debt is expected to fall to 59% of GDP this year, from 63.6% in 2018 and 68.4% in 2017, based on European Commission estimates.
Sources:
- Residential Property Price Index October 2019 (Central Statistics Office):https://www.cso.ie/en/releasesandpublications/ep/p-rppi/residentialpropertypriceindexoctober2019/
- Property prices rise at lowest level since economic recovery (The Irish Times): https://www.irishtimes.com/business/construction/property-prices-rise-at-lowest-level-since-economic-recovery-1.4113172
- The Daft.ie House Price Report (Daft.ie): https://www.daft.ie/report/2019-Q3-houseprice-daftreport.pdf
- Property prices in Ireland slowing with Dublin entering negative figures for first time since 2013 (Irish Mirror): https://www.irishmirror.ie/news/irish-news/property-prices-ireland-slowing-dublin-17282671
- Davy downgrades housing forecasts as market cools (The Irish Times): https://www.irishtimes.com/business/economy/davy-downgrades-housing-forecasts-as-market-cools-1.4034942
- Irish central bank leaves mortgage-lending limits unchanged (Reuters): https://www.reuters.com/article/ireland-cenbank-mortgages/irish-central-bank-leaves-mortgage-lending-limits-unchanged-idUSS8N25T01F
- Central Bank resists calls for rolling mortgage-limit exemptions (The Irish Times): https://www.irishtimes.com/business/financial-services/central-bank-resists-calls-for-rolling-mortgage-limit-exemptions-1.3706971
- Mortgage Measures (Central Bank of Ireland): https://www.centralbank.ie/financial-system/financial-stability/macro-prudential-policy/mortgage-measures
- The Daft.ie Rental Price Report Q3 2019 (Daft.ie): https://www.daft.ie/report/2019-Q3-rental-daftreport.pdf
- New Dwelling Completions (Central Statistics Office): https://www.cso.ie/en/statistics/construction/newdwellingcompletions/
- Ireland Government Budget (Trading Economics): https://tradingeconomics.com/ireland/government-budget
- Economic forecast for Ireland (European Commission): https://ec.europa.eu/info/business-economy-euro/economic-performance-and-forecasts/economic-performance-country/ireland/economic-forecast-ireland_en
- World Economic Outlook Database, October 2019 (International Monetary Fund): https://www.imf.org/external/pubs/ft/weo/2019/02/weodata/weorept.aspx?
- Consumer Price Index (Central Statistics Office): https://www.cso.ie/en/releasesandpublications/er/cpi/consumerpriceindexnovember2019/