New Zealand’s amazing house price boom
New Zealand’s house prices are rising rapidly again, the impact of the ban on foreign homebuyers having waned. During 2019, the nationwide median house price soared by 12.3% to NZ$629,000 (US$ 414,599), according to the Real Estate Institute of New Zealand (REINZ), a sharp improvement from the previous year’s rise of 1.8%.
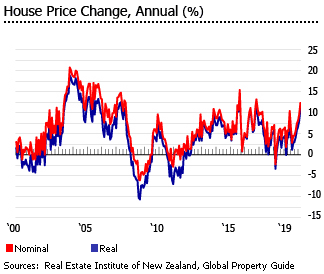
When adjusted for inflation, house prices rose by 10.8% in 2019. And during the latest quarter (Q4 2019), house prices increased by 5.4%.
However Auckland, which accounts for about 30% of total property sales in New Zealand, saw a modest house price growth of 3.5% during 2019.
The highest price increase was in the Southland, where prices surged by 32% during 2019. There were also double-digit house price hikes in Manawatu/Wanganui (27.8%), Gisborne (21.3%), Otago (21.2%), Hawke’s Bay (14.5%), Taranaki (14.1%), Tasman (12.5%), Northland (12.3%), Wellington (11.4%), and Marlborough (10.5%).
Strong to modest house price rises were seen in Nelson (9.4%), Waikato (9%), Bay of Plenty (4.1%), and Canterbury (1.1%). Only West Coast recorded a house price decline of 13.6% during 2019.
Auckland has average prices of NZ$ 890,000 (US$ 586,635) - the country’s most expensive - followed by Wellington, with an average price of NZ$ 685,000 (US$ 451,511), and Tasman, with an average price of NZ$ 655,000 (US$ 431,737).
The cheapest housing can be found in the West Coast, with an average price of NZ$ 190,000 (US$ 125,237), followed by Southland (NZ$ 330,000 or US$ 217,516), Manawatu/Wanganui (NZ$ 402,500 or US$ 265,304), and Gisborne (NZ$ 410,000 or US$ 270,247).
MEDIAN PRICES BY REGION, DECEMBER 2019 |
||||
| Regions | Median price | m-o-m change | y-o-y change | |
| NZD | USD | % | % | |
| NEW ZEALAND | 629,000 | 414,599 | -0.2 | 12.3 |
| Southland | 330,000 | 217,516 | 1.5 | 32.0 |
| Manawatu/Wanganui | 402,500 | 265,304 | 1.1 | 27.8 |
| Gisborne | 410,000 | 270,247 | 5.4 | 21.3 |
| Otago | 521,000 | 343,412 | -3.5 | 21.2 |
| Hawke’s Bay | 520,000 | 342,753 | -3.0 | 14.5 |
| Taranaki | 430,000 | 283,430 | 5.5 | 14.1 |
| Tasman | 655,000 | 431,737 | 8.3 | 12.5 |
| Northland | 539,000 | 355,276 | 6.7 | 12.3 |
| Wellington | 685,000 | 451,511 | -0.7 | 11.4 |
| Marlborough | 475,000 | 313,092 | -3.1 | 10.5 |
| Nelson | 605,000 | 398,780 | -0.8 | 9.4 |
| Waikato | 577,500 | 380,653 | -2.4 | 9.0 |
| Bay of Plenty | 635,000 | 418,554 | -0.2 | 4.1 |
| Auckland | 890,000 | 586,635 | 0.6 | 3.5 |
| Canterbury | 460,000 | 303,204 | -1.1 | 1.1 |
| West Coast | 190,000 | 125,237 | -9.1 | -13.6 |
| Sources: Real Estate Institute of New Zealand (REINZ), Global Property Guide | ||||
New Zealand saw spectacular house price rises of about 114% (82.5% inflation-adjusted) from 2001 to 2007. Then after a pause, there were six further years of substantial price rises 2012-2017, supported by strong economic growth. Because of this, housing in New Zealand has become really expensive, for a country with such a small population relative to its landmass.
New Zealand’s economy expanded by 2.5% in 2019, according to the International Monetary Fund (IMF). For the last six years the economy’s performance has been robust, with growth of 2.8% in 2018, 2.6% in 2017, 4.2% in 2016, 4% in 2015 and 3.1% in 2014.
The economy is projected to grow further by 2.7% this year and by another 2.6% in 2021, according to IMF estimates.
Foreign homebuyers are now virtually nonexistent
The results of these price pressures are clear. Around 40,000 people in New Zealand, or 1% of the population, are living on the streets or in emergency accommodation, according to a recent study conducted by Yale University. This is the highest rate of homelessness in any developed country.
In recent years buying tours by Chinese speculative buyers have caused concern. The issue dominated the October 2017 elections, which saw the Labour prime minister Jacinda Ardern ending nine years of government by the conservative National Party. The new government took over the previous government’s plans to introduce legislation to ban foreigners from buying homes in New Zealand.
In August 2018, the parliament finally passed the Overseas Investment Amendment Act, effective in October 2018, prohibiting non-resident foreigners from buying existing homes in the country. There are some exceptions, though. Foreigners with NZ residency status are still allowed to buy houses, as well as people from Australia and Singapore, due to existing free-trade agreements. Foreigners who already own homes in NZ are also not affected by the new law.
In the first three quarters of 2019, only about 0.5% of total home transfers in the country were to people without NZ citizenship or resident visas, down from 2.6% in 2018 and 2.4% in 2017, according to Statistics New Zealand.
Before the ban, foreign homebuyers accounted for just 2.5% to 3% of total property sales. However, in central Auckland and the southern scenic hot spot of Queenstown, foreigners accounted for about 22% and 5% of total sales, respectively.
Recently, the IMF urged the NZ government to reconsider the ban, as it is unlikely to improve housing affordability in the country. It also warned the move could discourage foreign investment needed to build new homes.
“Is the ban wise or useful? We think it’s neither,” said Dave Platter of Chinese real estate portal Juwai.com. “Foreign buying…tends to be focused on new development, making clear again that foreign investment leads to the creation of new dwellings. That’s vital in a market with a housing shortage, like Auckland.”
Local demand rising strongly
Despite the absence of foreign homebuyers, domestic demand remains very strong. Property sales in New Zealand rose by 12.3% to 6,285 units during the year to December 2019, according to the REINZ.
- In Auckland, the number of properties sold surged 31.7% y-o-y to 1,860 units in December 2019
- For New Zealand excluding Auckland, property sales increased 5.8% y-o-y to 4,425 units over the same period
“The property market had a solid end to the decade with a 12.3% increase in the number of properties sold in December 2019 when compared to December 2018. That’s an additional 22 houses sold each day around the country in December, which is not an insignificant number,” said Bindi Norwell, Chief Executive at REINZ.
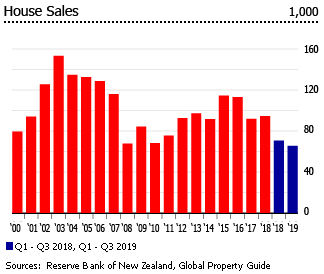
Outside Auckland, Bay of Plenty recorded the highest growth in property sales, rising by 21.5% y-o-y in December 2019, followed by Southland (18.3%), Northland (17.3%), Canterbury (16.1%), and Tasman (11.8%). More modest sales increases were seen in Nelson (6.6%), Taranaki (4.5%), Otago (3.1%), Waikato (2.5%), Wellington (1.6%), and Marlborough (1.2%).
The biggest annual sales decline was registered in West Coast, with the number of properties sold falling by 43.5% during the year to December 2019. Annual sales declines also occured in Gisborne (-18.5%), Manawatu/Wanganui (-14.2%), and Hawke’s Bay (-1.4%).
Nationwide, the number of days-on-market fell by four days to 31 days in December 2019 from a year ago, according to the REINZ.
The number of properties available for sale in New Zealand fell by 24.5% to 18,230 units in December 2019 from a year earlier – the lowest level of inventory since records began.
Residential construction boom continues
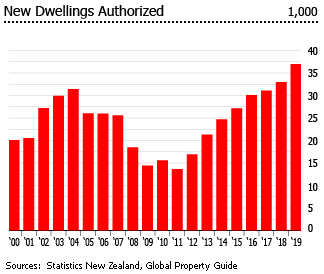
In the first eleven months of 2019, the total number of new dwelling consents in New Zealand rose by 13.1% y-o-y to 34,628 units, according to Statistics New Zealand. All the country’s major regions saw strong growth in building permits.
- In Auckland consents were up 16.8% y-o-y to 13,928 units in the first eleven months of 2019.
- In Waikato, consents rose by 12.4% y-o-y to 3,921 units in Jan-Nov 2019
- In Wellington, consents surged 11.8% y-o-y to 2,879 units
- In Canterbury, consents surged by 12.4% y-o-y to 4,911 units
- In the rest of North Island, consents rose by 6.4% y-o-y to 5,445 units
- In the rest of South Island, consents were up by 13.1% to 3,543 units in Jan-Nov 2019 from a year earlier
The value of new dwelling consents also increased 13.5% y-o-y to NZ$12.83 billion (US$8.46 billion) in the first eleven months of 2019.
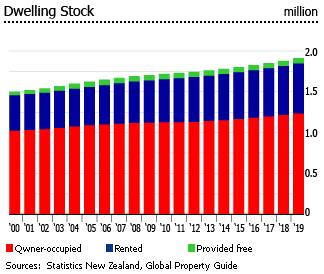
More than 64.5% of New Zealand dwellings are owner-occupied while 32% are rented. The remaining 3.4% are provided for free.
A short history of New Zealand’s housing boom
House prices in New Zealand surged by almost 114% (82.5% inflation-adjusted) during the previous housing boom from 2001 to 2007, including 24.8% in 2003, 12.2% in 2004, 15.3% in 2005, 9.7% in 2006, and 8% in 2007. Big rises - but then, this was a period when the economy expanded by an average of 3.7% every year.
House prices started to fall in early 2008, but the decline was much less than in other countries. After falling by 8.95% in 2008, house prices rose by 5.42% in 2009 – but only to fall again by 1.67% in 2010.
Supported by healthy economic fundamentals, the housing market started to recover in 2011, registering a modest house price growth of 2.82%. New Zealand saw another housing boom in the following years, with prices soaring by 77.2% (61.1% inflation-adjusted) from 2011 to 2019, including double-digit price rises in 2015 (11.49%), 2016 (13.85%) and 2019 (12.32%).
HOUSE PRICE INDEX, ANNUAL CHANGE (%) |
||
| Year | Nominal | Inflation-adjusted |
| 2008 | -8.95 | -11.93 |
| 2009 | 5.42 | 3.40 |
| 2010 | -1.67 | -5.48 |
| 2011 | 2.82 | 0.96 |
| 2012 | 6.86 | 5.86 |
| 2013 | 9.18 | 7.44 |
| 2014 | 6.34 | 5.54 |
| 2015 | 11.49 | 11.39 |
| 2016 | 13.85 | 12.35 |
| 2017 | 6.28 | 4.61 |
| 2018 | 1.82 | -0.07 |
| 2019 | 12.32 | 10.81 |
| Sources: RBNZ, REINZ, Global Property Guide | ||
Immigration and the housing market
One reason for strong house price rises has been the healthy expansion of New Zealand’s economy.
A second reason was low interest rates.
A third reason was high immigration.
During the year to September 2019, New Zealand’s net immigration was 54,623 people, at par with the annual average of 54,011 people from 2014 to 2017, based on figures from Statistics New Zealand. In fact, permanent and long-term net migration surged to an average of 64,300 people in the past five years.
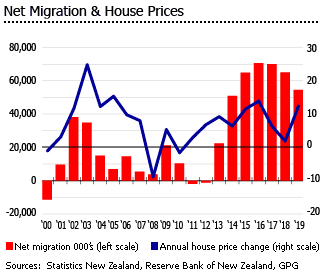
From 2005 to 2012, the country’s net migration averaged only 7,446 people every year, because of the weak economy and low employment opportunities. In contrast, net permanent and long-term immigration was more than 38,000 people in 2002, 35,000 in 2003 and 15,000 in 2004.
International migrant flows have a significant impact on house price movements and construction activity in New Zealand. The housing boom of the early-2000s including the strong house price rises from 2012 to 2019 were strongly associated with strong immigration.
Are property prices too high? Maybe not - yields are good.
New Zealand’s house prices have been estimated by Deutsche Bank to be 30% overvalued relative to income, and 82% overpriced relative to rents, with Auckland the worst outlier. The Economist’s global house price index found that New Zealand house prices were 57% overvalued relative to income and 113% overvalued relative to rents.
“On this basis, house prices appear to be on an unsustainable path in Australia, Canada and New Zealand,” The Economist said. “Ten years ago they reached similarly dizzying heights against rents and incomes in Spain, Ireland and some American cities, only to endure a brutal collapse.”
New Zealand, particularly Auckland, was rated as “severely unaffordable” with a median multiple of 8.6 this year, according to the 16th Annual Demographia International Housing Affordability Survey: 2020. Despite falling from a median multiple of 9.0 in 2019, Auckland actually rose two notches, from being ranked as the ninth most expensive city in 2019 to seventh this year.

Among the eight developed nations covered by the survey, New Zealand was ranked second most unaffordable major housing market in 2020.
However these assessments of overvaluation and severe unaffordability are contradicted by the Global Property Guide’s own research, which suggests that rental yields in New Zealand’s prime cities are reassuringly high by international standards, and that on this measure, New Zealand’s high residential property prices are amply justified (see below).
Rental yields are very good in Auckland and Wellington, poor in Christchurch
For a developed economy, yields in New Zealand are attractive.
In Auckland, rental yields on apartments range from 6.09% to 7.18%, according to Global Property Guide research. The key to getting good yields is smaller apartments, which earn much more than large apartments.
And rental returns on apartments in Wellington have now moved ahead of Auckland. Rental yields ranged from 6.88% to 8.43%, with smaller apartments earning more.
In Christchurch, rental returns on houses, which are usually lower than on apartments, range from 2.96% to 4.26%.
Rents continue to rise
Nationwide, the average rent for private residences reached NZS 500 (US$ 330) per week during the year to November 2019 – up by 4.2% from a year earlier, according to TradeMeProperty. Clancy noted that the number of properties available to rent was flat while demand surged 17% from a year ago.
“The pace of rent growth across the country will be alarming for a lot of tenants and the trend we’re seeing now suggests the peak season in summer is going to deliver some new price records,” said Trade Me’s Head of Rentals Aaron Clancy. “Demand for rentals has increased enormously year-on-year and until there’s a spike in supply high rents will be the new normal.”
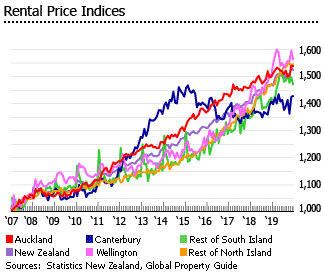
This was supported by Statistics New Zealand, which showed that the national rental price index increased 3.5% in 2019 from a year earlier.
Wellington City is now the most expensive city in New Zealand to rent after its median weekly rent rose to NZ$ 585 (US$ 386), according to Trade Me Rental Price Index. It was followed by Auckland City with median rent of NZ$ 560 (US$ 369) per week.
Regionally, Manawatu/Wanganui registered the biggest growth in residential rents of 15.2% during the year to November 2019, followed by Wellington (10%), Nelson/Tasman (9.8%), Gisborne (8.7%), Waikato (8.4%), Taranaki (7.7%), Northland (7.5%), and Bay of Plenty (6.8%). More modest rent increases were also seen in Marlborough (3.7%), West Coast (3.7%), Southland (3.4%), Canterbury (2.5%), Otago (2.4%), and Auckland (1.8%). Rents were unchanged in Hawke’s Bay.
Mortgage interest rates continue to fall
The RBNZ recently decided to keep the Official Cash Rate (OCR) unchanged from the historic low of 1%, following two rate cuts last year (25 basis points in May 2019 and 50 basis points in August 2019). That’s because while employment is already near its maximum sustainable level, inflation remains below the central bank’s 2% target, said the RBNZ.
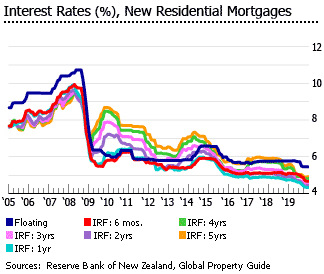
Residential mortgage interest rates in December 2019:
- Floating mortgage rate: 5.45%, down from last year’s 5.77%
- 6 months initial rate fixation (IRF): 4.66%, down from the previous year’s 5.1%
- 1 year IRF: 4.32%, down from 4.75% a year earlier
- 2 years IRF: 4.44%, down from 4.93% a year earlier
- 3 years IRF: 4.5%, down from 5.07% a year earlier
- 4 years IRF: 4.8%, down from 5.4% a year earlier
- 5 years IRF: 4.91%, down from 5.58% a year earlier
Mortgage market continues to expand
New Zealand’s mortgage market has ballooned to 88.4% of GDP in 2019, up from just 51.4% of GDP in 1998. In Q3 2019, the total value of outstanding housing loans rose by 6.1% y-o-y to about NZ$ 269.44 billion (US$ 177.65 billion), according to the RBNZ.
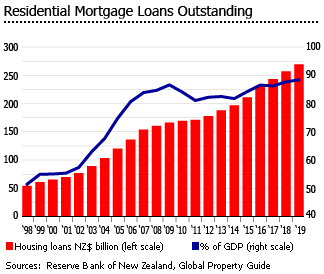
In the first eleven months of 2019, the total value of new residential mortgage lending increased 4.6% to NZ$61.67 billion (US$40.66 billion) from a year earlier. Loans drawn by owner-occupiers, including first time homebuyers, who accounted for about 80% of new residential mortgage loans, rose by 9% y-o-y in NZ$49.38 billion (US$ 32.55 billion) over the same period.
The Reserve Bank of New Zealand (RBNZ) maintains loan value restrictions
During its latest Financial Stability Report released last November 2019, the RBNZ maintained its Loan to Value Ratio (LVR) restrictions, as risks to the financial system remain elevated, RBNZ Governor Adrian Orr noted.
“There remains the risk that prolonged low interest rates could lead to a resurgence in higher-risk lending,” said Orr. “As such, we have decided to leave the LVR restrictions at current levels at this point in time.”
Tighter lending restrictions were implemented in October 2016, in an effort to curb house price growth and discourage speculative buying. These were eased somewhat in January 1, 2019: the permissible proportion of borrowers with a deposit of less than 20% was raised from 15% to 20% of a bank’s total lending to owner-occupiers. In addition, the central bank also somewhat relaxed conditions on new mortgage loans to property investors.
Robust economic growth; healthy government finances
New Zealand’s economy was estimated to have expanded by 2.5% in 2019, according to the IMF. For the last six years, the economy’s performance has been robust, with growth of 2.8% in 2018, 2.6% in 2017, 4.2% in 2016, 4% in 2015 and 3.1% in 2014.
After the Asian financial crisis New Zealand experienced years of unbroken economic growth. The economy grew by an average of 3.8% per year from 1999 to 2007.
During the recent global crisis the economy contracted only briefly and mildly - by 0.4% in 2008. The economy grew slightly by 0.3% in 2009. New Zealand emerged swiftly from recession, after only five quarters of negative GDP.
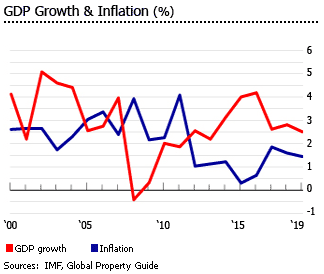
The economy is projected to grow further by 2.7% this year and by another 2.6% in 2021, based on the IMF estimates.
The government recorded an operating surplus of NZ$7.5 billion (US$ 4.94 billion) during the 2019 fiscal year – more than double the forecast of NZ$3.47 billion and the biggest surplus since 2008, according to the Treasury. This was largely due to a surge in tax revenue, which increased by 7.8% to NZ$86.5 billion (US$ 57 billion).
New Zealand’s net external debt continues to fall, at around 19.2% of GDP in the 2018-19 fiscal year, a decline from 19.9% in 2017-18, 22.2% in 2016-17 and 24.4% in 2015-16.
Unemployment stood at 4.2% in Q3 2019, up from 3.9% in the previous quarter and 4% a year earlier, according to the Statistics New Zealand. There were about 115,000 unemployed people in Q3 2019.
Inflation was 1.5% during the year to Q3 2019, down from 1.7% in the previous quarter and 1.9% a year ago. The current inflation is within the RBNZ’s target range of 1% to 3% for 2019.
The next general election is tentatively scheduled for September this year.
Sources:
- Residential Property Data (Real Estate Institute of New Zealand): https://www.reinz.co.nz/residential-property-data-gallery
- Good rental returns in Wellington and Auckland (Global Property Guide): https://www.globalpropertyguide.com/Pacific/New-Zealand/Rental-Yields
- Property transfer statistics: September 2019 quarter (Statistics New Zealand): https://www.stats.govt.nz/information-releases/property-transfer-statistics-september-2019-quarter
- Rental price indexes: December 2019 (Statistics New Zealand): https://www.stats.govt.nz/information-releases/rental-price-indexes-december-2019
- Rental prices continue their surge toward summer (Trade Me Property): https://property.trademe.co.nz/market-insights/rental-price-index/rental-prices-continue-their-surge-toward-summer/
- World Economic Outlook Database, October 2019 (International Monetary Fund): https://www.imf.org/external/pubs/ft/weo/2019/02/weodata/index.aspx
- New and existing residential mortgage lending by payment type - C32 (Reserve Bank of New Zealand): https://www.rbnz.govt.nz/statistics/c32
- Official Cash Rate unchanged at 1 percent (Reserve Bank of New Zealand): https://www.rbnz.govt.nz/news/2019/11/official-cash-rate-unchanged-at-1-percent
- 16th Annual Demographia International Housing Affordability Survey (Demographia): http://demographia.com/dhimedia2020.pdf
- Auckland one of world’s most ‘overvalued’ cities for housing (One Roof): https://www.oneroof.co.nz/news/auckland-one-of-the-worlds-most-overvalued-city-for-housing-35261
- Our armour-plated housing bubble (Newsroom): https://www.newsroom.co.nz/2019/07/18/686320/our-armour-plated-housing-bubble
- New Zealand net migration rate remains high (Statistics New Zealand): https://www.stats.govt.nz/news/new-zealand-net-migration-rate-remains-high
- RBNZ maintains LVR mortgage restrictions (Newsroom): https://www.newsroom.co.nz/2019/11/27/922059/rbnz-maintains-lvr-mortgage-restrictions#
- Govt books continue to improve: assets up, debt down (Newsroom): https://www.newsroom.co.nz/2019/10/08/849234/government-books-continue-to-improve-assets-up-and-debt-down
- Crown accounts: Government's $7.5b surplus is the biggest since 2008 GFC (NZ Herald): https://www.nzherald.co.nz/nz/news/article.cfm?c_id=1&objectid=12274510
- Unemployment rate (Statistics New Zealand): https://www.stats.govt.nz/indicators/unemployment-rate
- Consumers price index (CPI) (Statistics New Zealand): https://www.stats.govt.nz/indicators/consumers-price-index-cpi