Uzbekistan's Residential Property Market Analysis 2026
Uzbekistan's housing market is growing again on every official measure. House prices have risen for three consecutive quarters, mortgage lending is up by more than a third this year, and buyers rushed to complete a record number of deals in March before new escrow rules took effect. Yet with inflation still above 6%, prices are barely keeping pace in real terms, and the official price index itself was rebuilt from the ground up this year.
This extended overview from Global Property Guide covers key aspects of the Uzbek housing market and takes a closer look at its most recent developments and long-term trends.
Table of Contents
- Property Prices and Price Index
- Historic Perspective
- Property Demand Trends
- Property Supply Trends
- Rental Market: Rents and Rental Yields
- Mortgage Market and Interest Rates
- Economic and Social Factors
Property Prices and Price Index
House prices in Uzbekistan are rising at a steady but unspectacular pace. According to the National Statistics Committee (NSC), the national residential property price index stood at 108.3 in Q3 2026 (2024 = 100), up 1.4% on the previous quarter and 4.7% on Q3 2025. It was the third consecutive quarterly increase, following a 1.4% decline in Q4 2025. The NSC has published the Q3 index levels but not yet its Q3 annual-change table or press release, so the annual figures for Q3 in this article are calculated from the published index levels.
The most recent fully published quarter tells the same story. In its Q2 2026 release, the NSC reported prices up 1.3% quarter-on-quarter and 4.0% year-on-year, with apartments up 5.5% and individual houses up 2.0%.
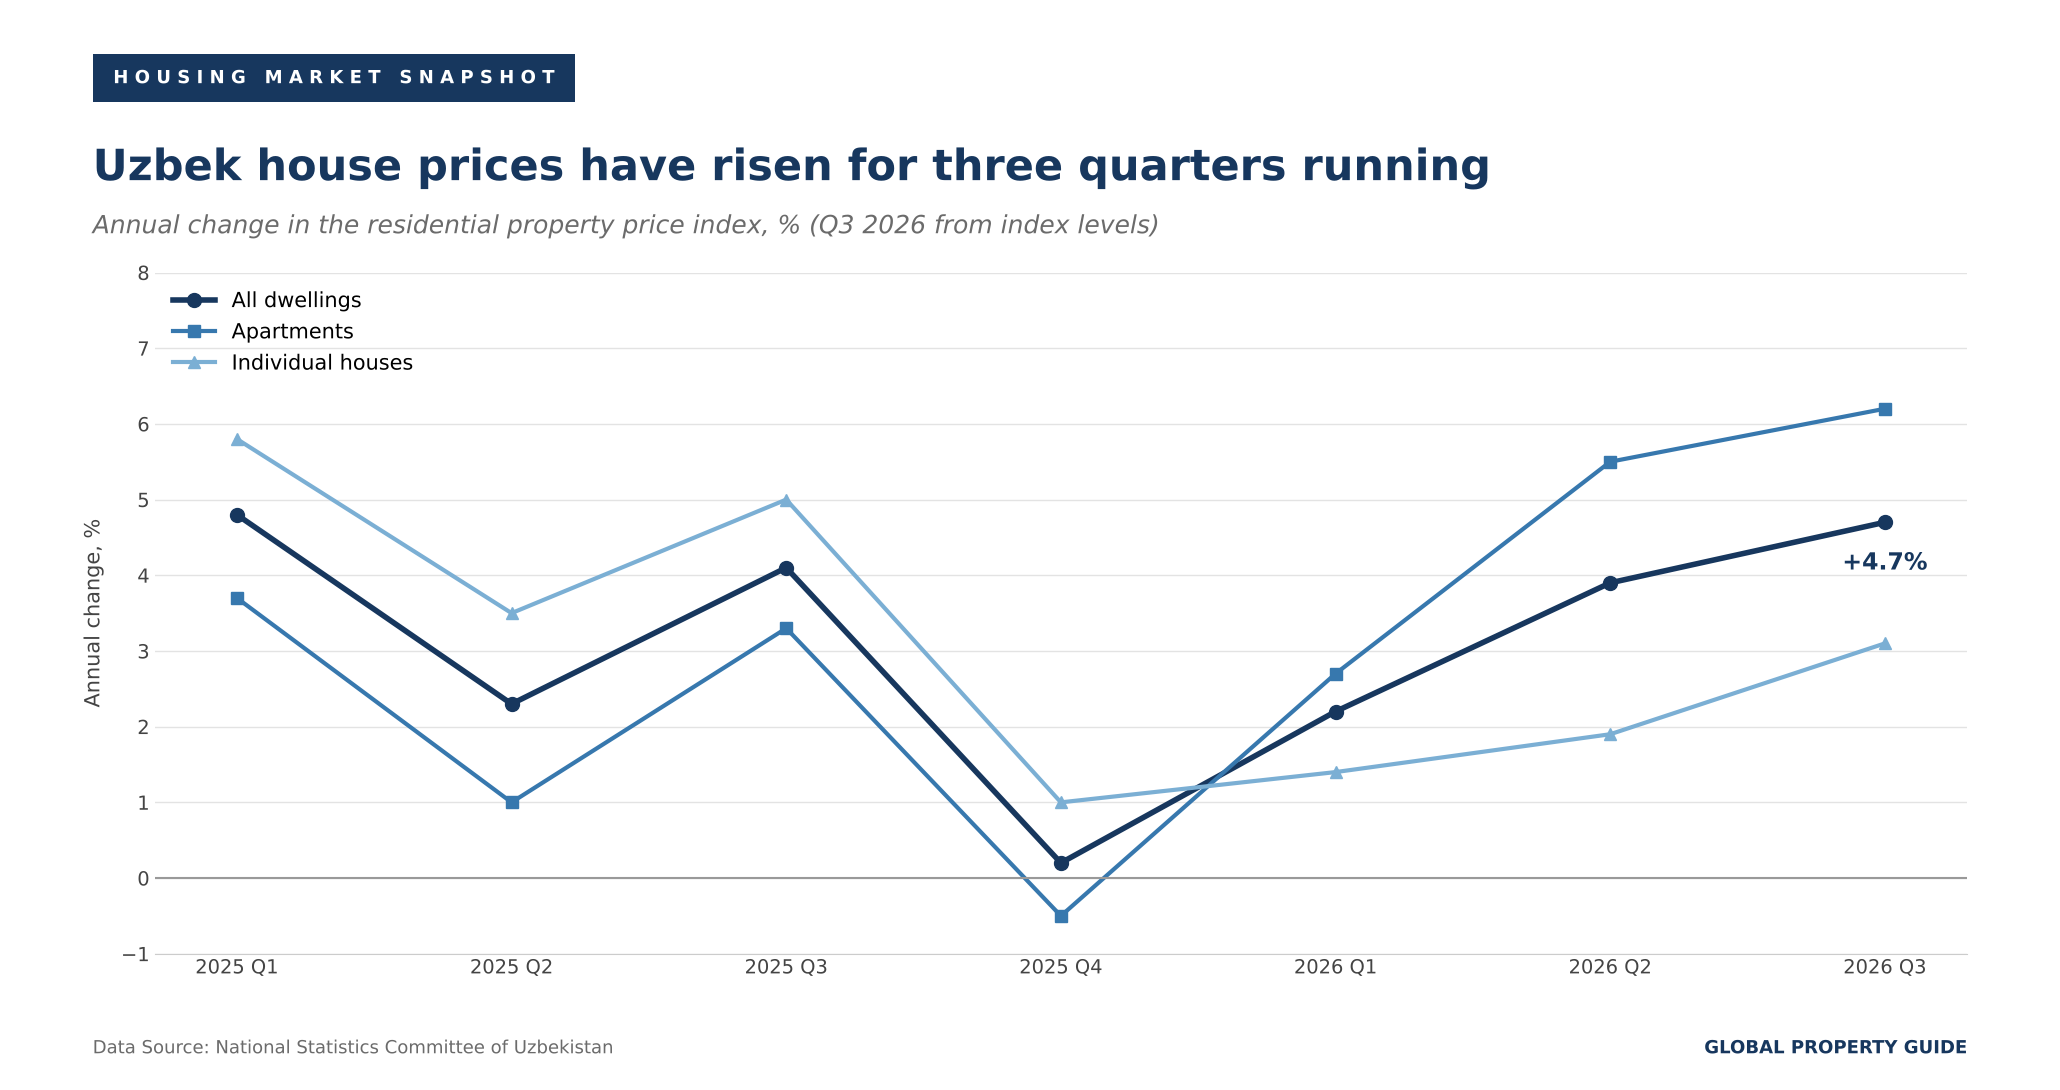
In real terms, however, the market is standing still. Consumer prices rose 6.4% in the year to September 2026, so the 4.7% nominal gain in the national index translates into a real decline of about 1.6%.
| Residential property price changes, Q3 2026 | |||
| Index, (USD)2024 = 100 |
QoQ, % | YoY, % | |
| All dwellings | 108.3 | 1.4% | 4.7% |
| All apartments | 108.4 | 1.2% | 6.2% |
| Primary market apartments | 113.0 | 1.9% | 6.7% |
| Secondary market apartments | 104.9 | 0.5% | 5.5% |
| Individual houses | 107.9 | 1.7% | 3.1% |
| Apartments, Tashkent city | 104.4 | n/a | 4.8% |
| Apartments, rest of Uzbekistan | 112.1 | 1.8% | 7.3% |
| Note: Quarterly changes from the NSC quarterly table; annual changes calculated from published index levels (10 October 2026 vintage). The NSC's own quarterly table for Tashkent apartments does not reconcile with its index levels and is not shown. | |||
| Data source: National Statistics Committee of Uzbekistan. | |||
The strongest gains are in new-build apartments outside the capital. The primary-market index for the regions stood at 115.2 in Q3 2026, 15.2% above its 2024 average. In Tashkent, by contrast, the secondary-market index stood at just 101.2, barely above where it was two years ago, after falling through most of 2025 and recovering only in 2026.
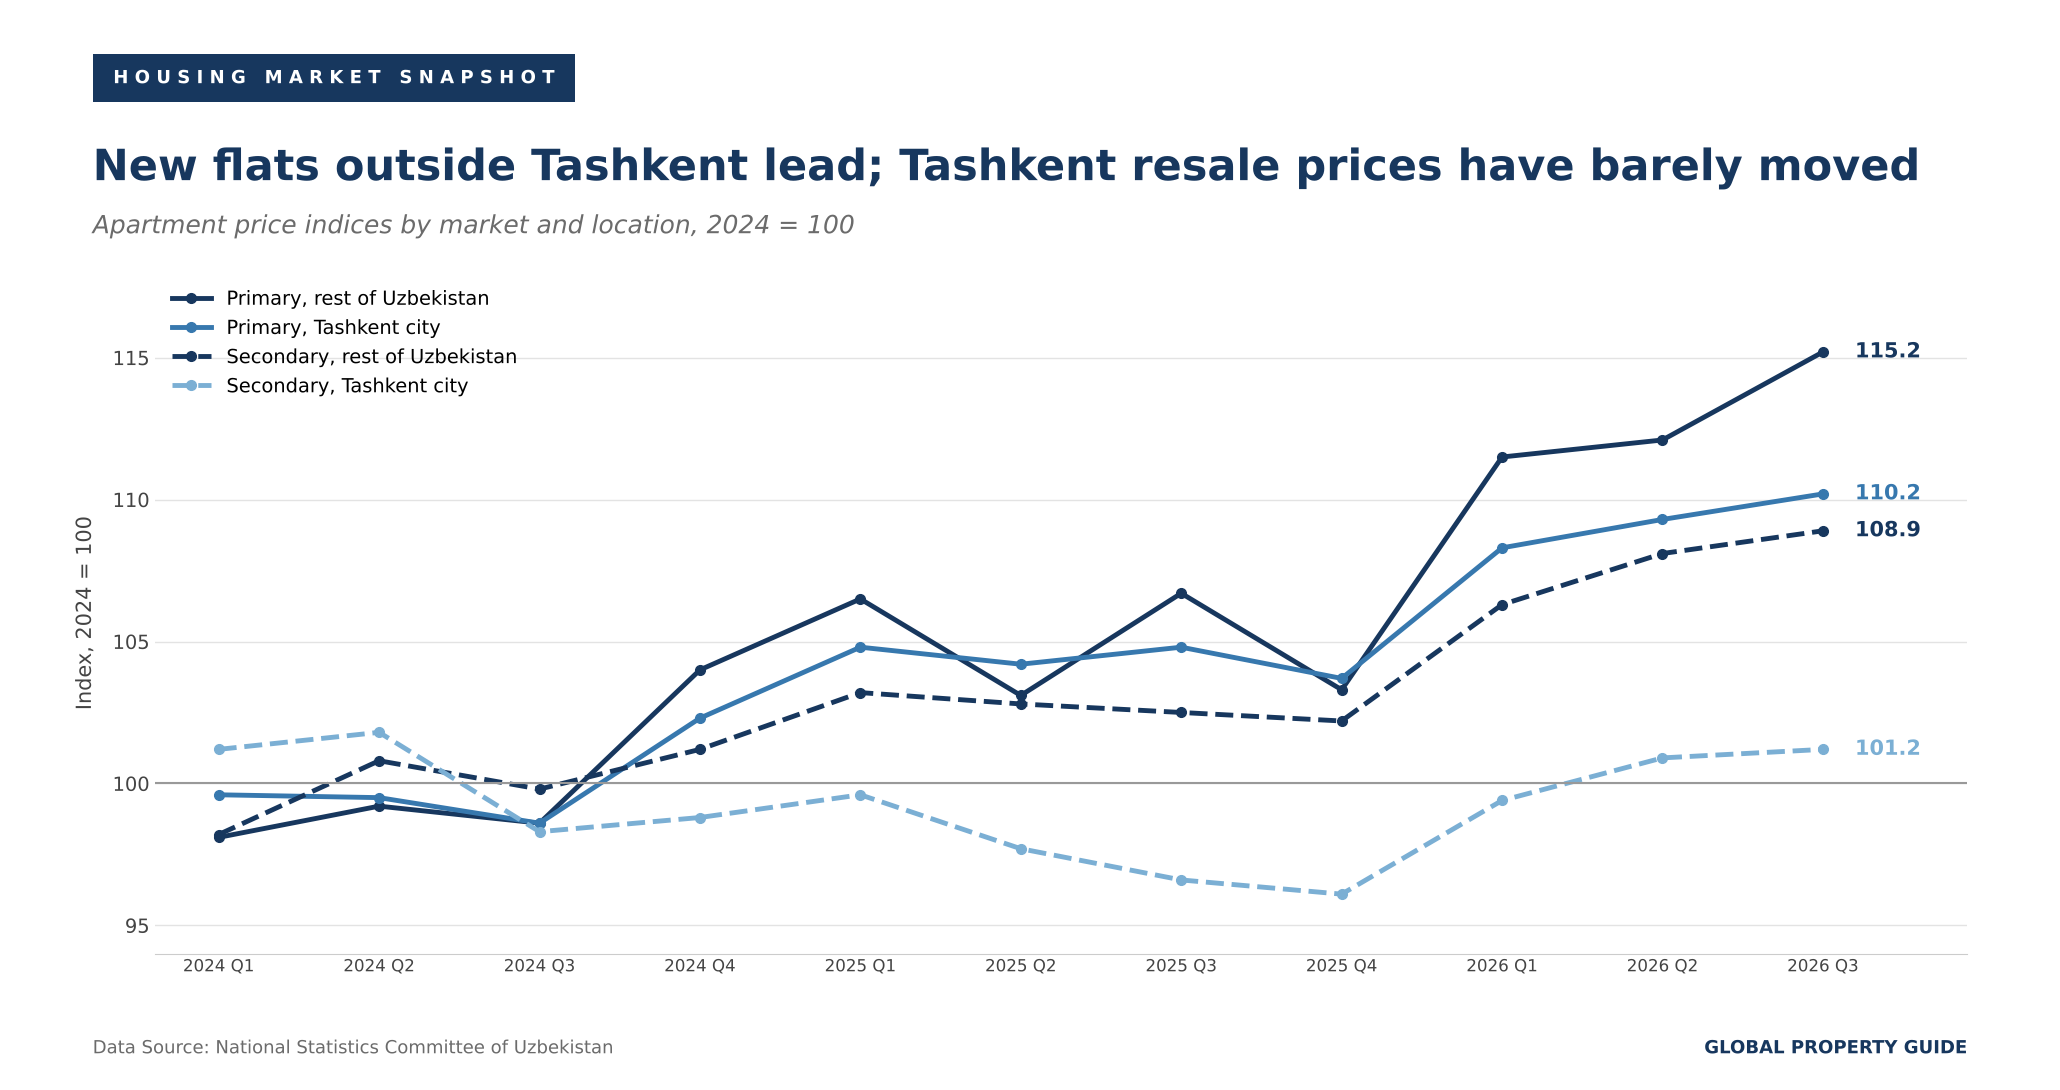
The two-speed pattern is consistent with private-sector data. The Center for Economic Research and Reforms (CERR), a government think tank, reported that secondary-market prices in Tashkent rose just 0.6% during 2025, with declines in several districts, while new-build prices in the capital rose by more than 9%. Nationally, secondary-market prices rose 7.9%, led by the regions: Surkhandarya was up nearly 19.5%, Karakalpakstan 15.6% and Fergana 15.5%.
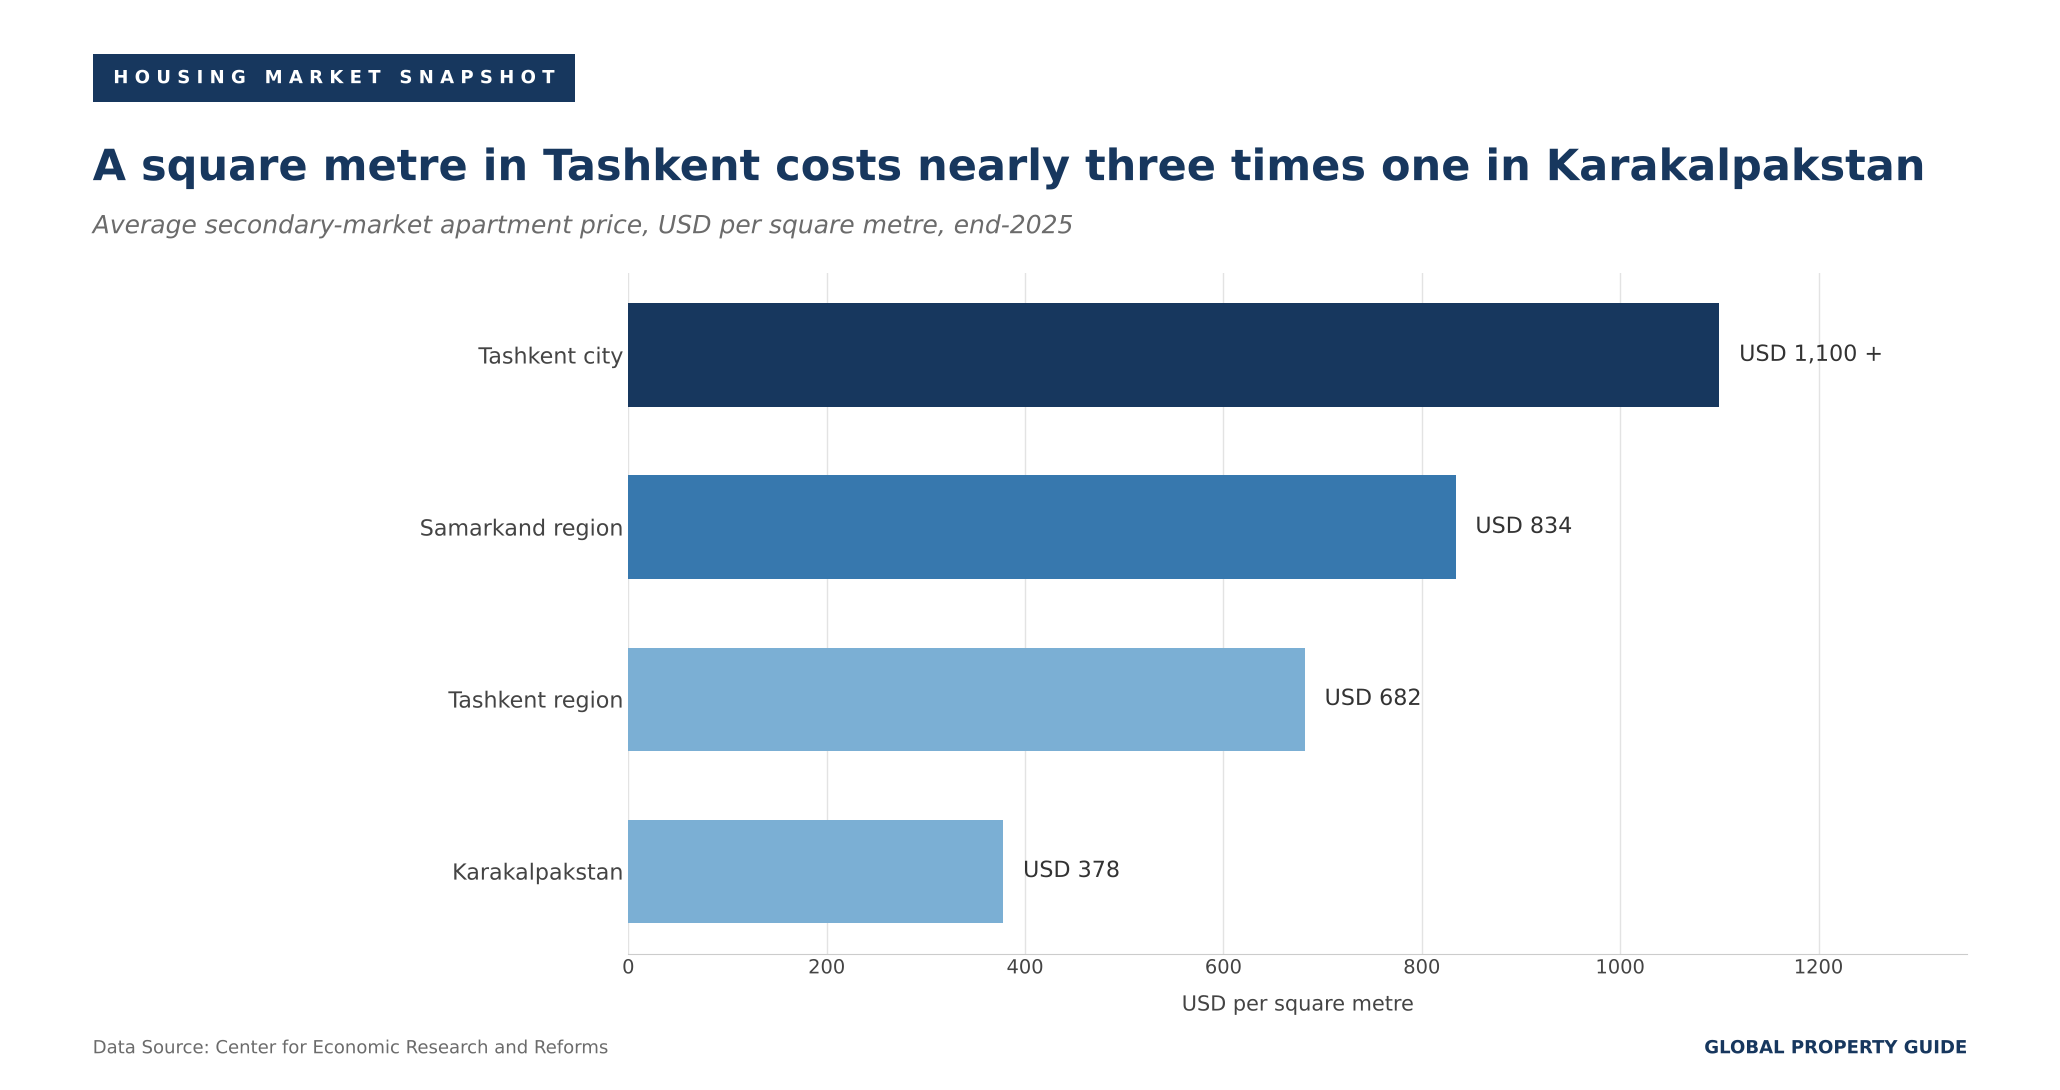
Price levels still differ enormously across the country. CERR put the average secondary-market apartment price in Tashkent at more than USD 1,100 per square metre at the end of 2025, against USD 834 in Samarkand region, USD 682 in Tashkent region and about USD 378 in Karakalpakstan.
| Average secondary-market apartment prices, end-2025 | |
| Region | Price per sqm (USD) |
| Tashkent city | more than USD 1,100 |
| Samarkand region | USD 834 |
| Tashkent region | USD 682 |
| Republic of Karakalpakstan | about USD 378 |
| Data source: Published in US dollars by CERR; not converted at this article's exchange rate. | |
| Data source: Center for Economic Research and Reforms. | |
Dollar pricing is a structural feature of the market. The Central Bank of Uzbekistan (CBU) notes in its Q3 2025 review that many sellers continue to set asking prices in foreign currency to preserve the value of their assets. With the soum appreciating, this has opened a wide gap between price growth measured in soums and in dollars. In June 2026, the CBU recorded primary-market apartment prices up 6.2% year-on-year in soums but 12.0% in dollars, and secondary-market prices up 6.3% in soums and 12.2% in dollars. For foreign buyers, the dollar figure is the relevant one.
One limitation applies throughout. The NSC index is built from asking prices in online listings, mainly on OLX.uz, supplemented by Telegram real estate channels where coverage is thin. It measures what sellers are asking, not what buyers pay.
Historic Perspective
A Boom, a Correction, and a New Index
Uzbekistan's housing market cannot be read over a long horizon without first dealing with a break in the data. From Q2 2026, the NSC replaced its housing price index with a new one built on hedonic regression, which adjusts for floor area, location, floor level, and other characteristics, and extended coverage to individual houses. The new series was recalculated back to 2024 only.
The Old Index Recorded a Boom and Then a Fall
The discontinued index, compiled from statistical reporting forms since 2022, shows an exceptional boom. Annual price growth accelerated from 4.8% in Q1 2022 to 16.4% by Q4 2022, then to 32.4% in Q4 2023 and a peak of 35.0% in Q1 2024. In Tashkent city, annual growth reached 36.7% in Q4 2023 and 39.5% in Q1 2024.
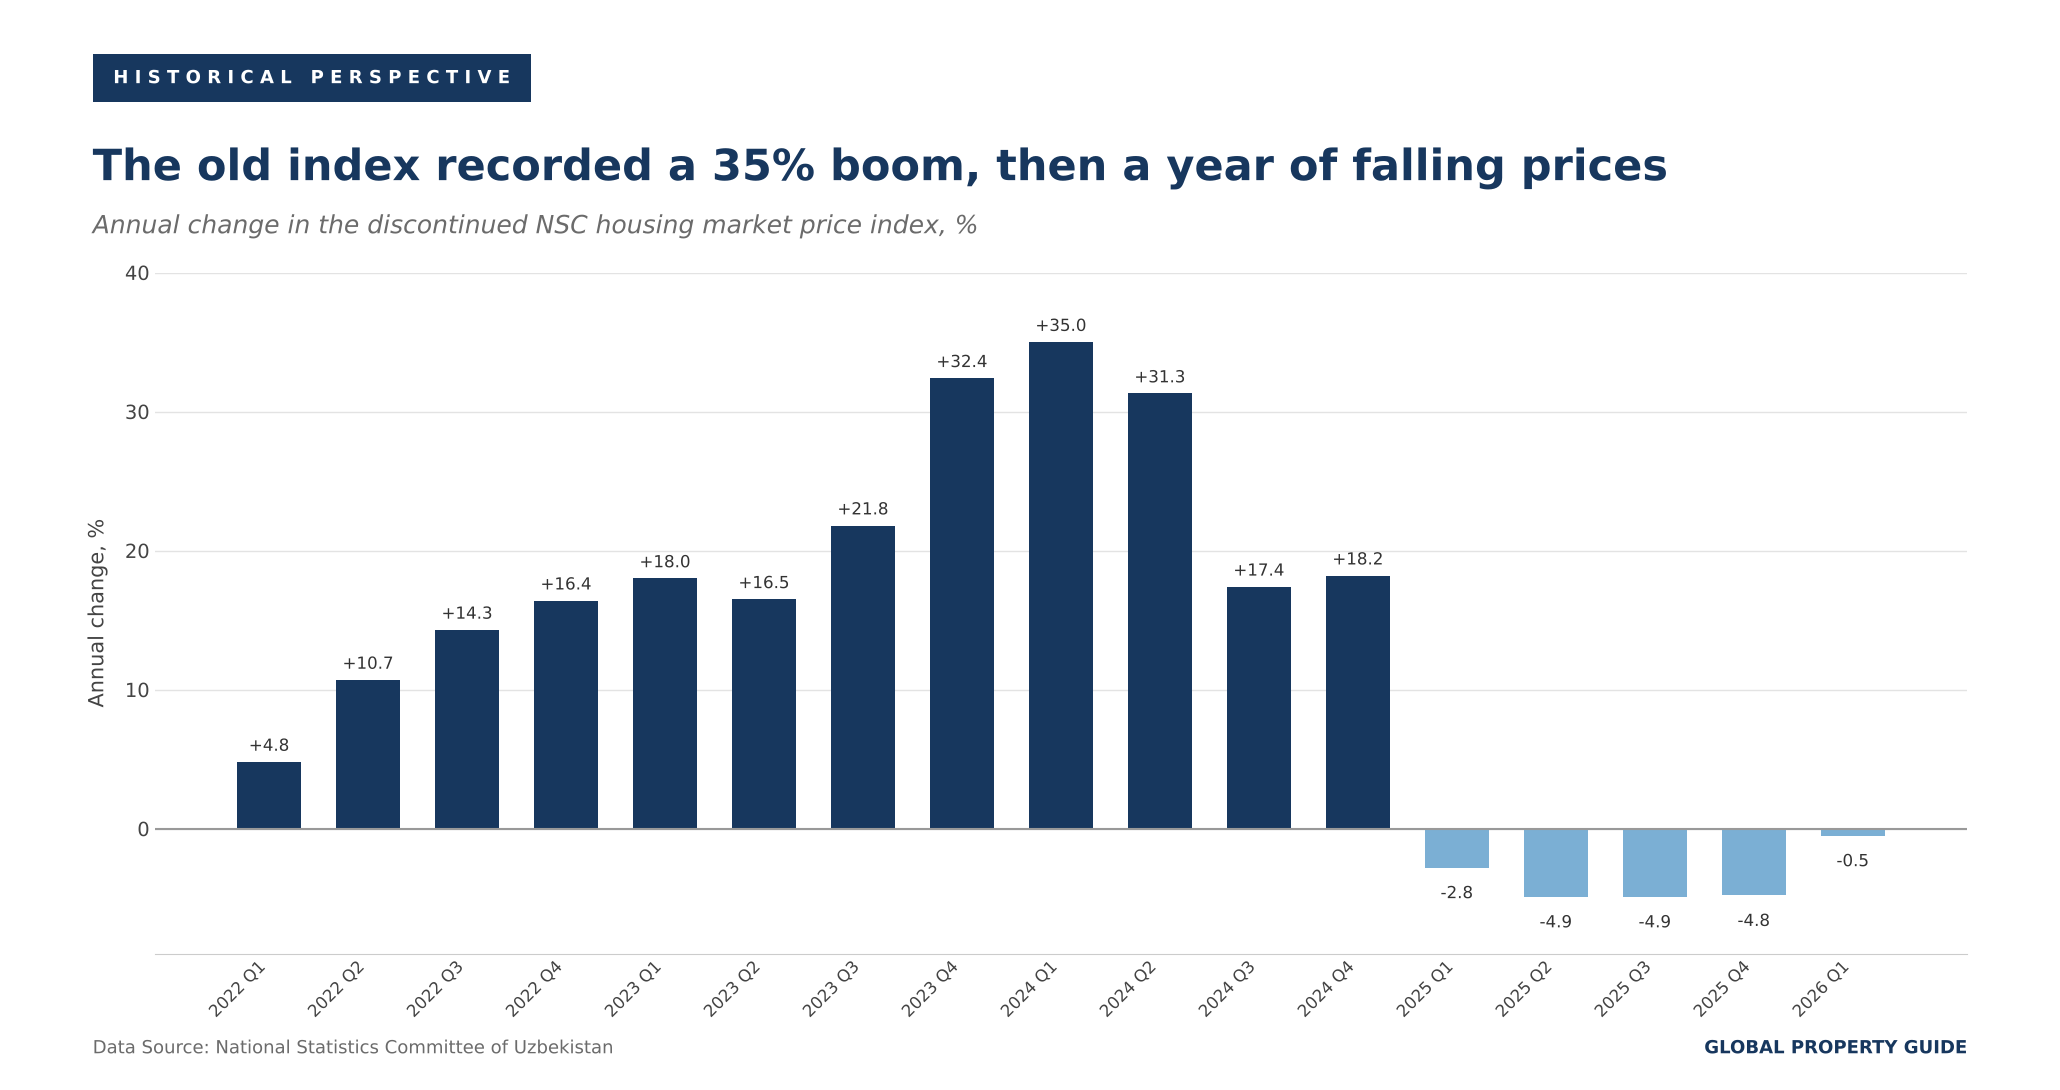
The boom ended abruptly. On the old measure, prices fell 2.8% year-on-year in Q1 2025 and between 4.8% and 4.9% in each of the following three quarters, before steadying at a 0.5% decline in Q1 2026, the last quarter it was published. Chaining the fourth-quarter annual changes, prices on the old measure rose by about 73% between the end of 2021 and the end of 2025, despite the 2025 correction.
The Two Indices Disagree About 2025
The new hedonic index does not show a fall in 2025 at all. It records annual gains in every quarter of 2025, ranging from 0.2% in Q4 to 4.8% in Q1. For 2025, the two measures disagree in direction by between five and nine percentage points.
The NSC presents the new method as a more accurate measure of pure price change because it strips out shifts in the mix of properties being sold. The practical point for readers is that the two series are not comparable. Claims about how much prices fell in 2025 depend entirely on which index is used, and the long-run history before 2024 exists only on the old basis.
The Central Bank had flagged the overheating. In its 2024 Financial Stability Report, it estimated that home prices stood about 17% above their fundamental value, and it noted that banks had slightly tightened mortgage lending standards during 2024, cutting the average maturity of new mortgages by 0.8 years to 16.6 years.
Property Demand Trends
A Rush Before Escrow, Then a Return to Normal
Transaction data in 2026 are dominated by one event: the introduction of mandatory cashless settlement through escrow-type bank accounts for notarised property sales on 1 April 2026.
According to the CBU, 110,051 residential purchase and sale transactions were registered in Q1 2026, up 48.4% year-on-year. March alone accounted for 47,313 deals, up 112% on March 2025 and 43% of the quarter's total. The CBU attributes the surge directly to market participants rushing to formalise agreements before the new system took effect.
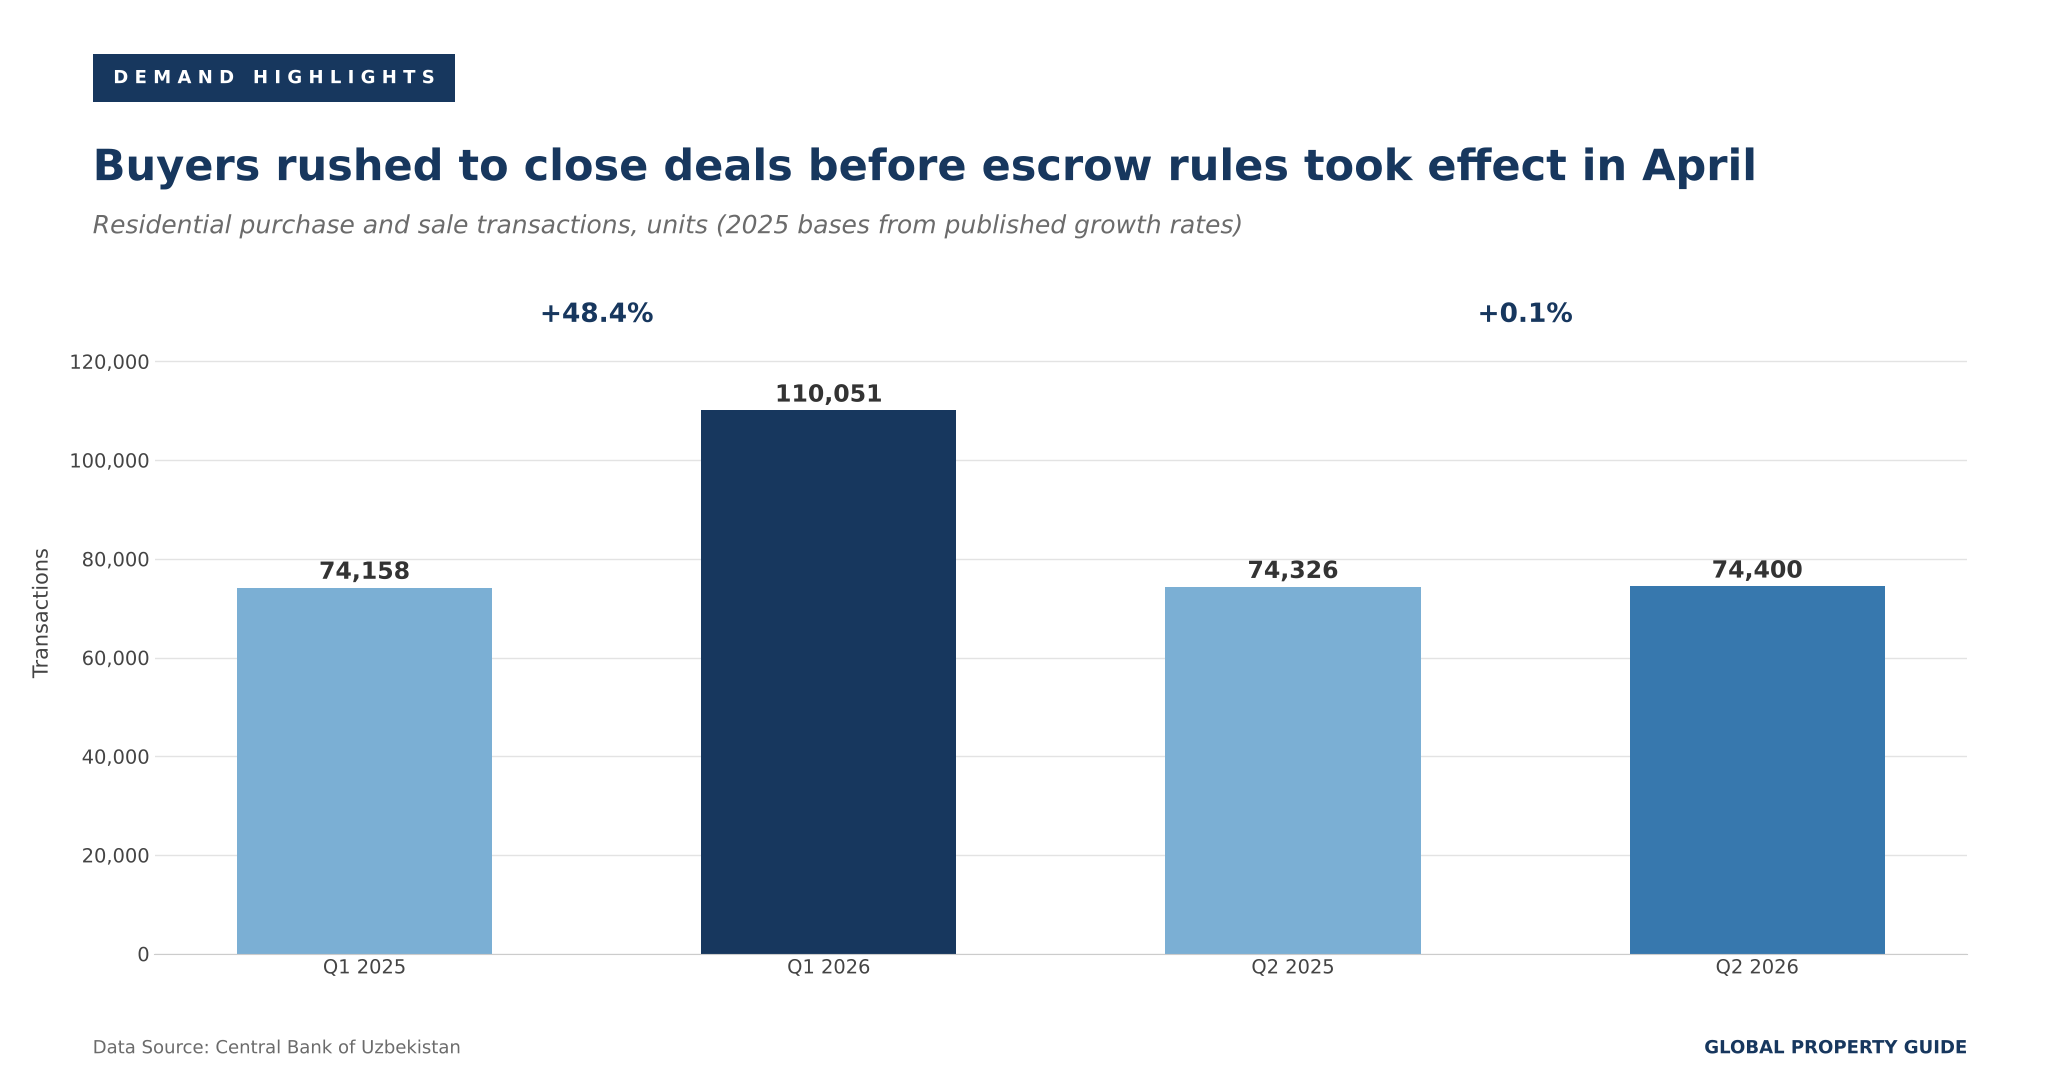
The rush borrowed from the following months. In Q2 2026, transactions fell to 74,400, 32% below the first quarter and just 0.1% above Q2 2025. Regionally, Khorezm (up 17.8%), Navoi and Syrdarya (both up about 7.5%) and Karakalpakstan (up 6.1%) posted the strongest annual growth in Q2, while Tashkent city rose 2%. Fergana, Bukhara, Jizzakh, Samarkand and Tashkent region recorded slight declines.
Activity Has Settled at a Steady Monthly Pace
CERR data, which use a slightly different count from the CBU's, show activity recovering to between 25,000 and 26,000 transactions a month from early summer. In August 2026, 25,100 deals were recorded nationwide, up 0.2% year-on-year, of which 7,400 were in Tashkent, up 2.2%. Over the first eight months of 2026, transactions totalled 222,500, up 18.4% on the same period of 2025, with Tashkent up 27.5%, Syrdarya up 25.4% and Andijan up 23.8%.
Tashkent remains the largest single market by a wide margin, accounting for roughly 29% of national transactions in August.
Incomes and Credit Are Supporting Demand
The fundamentals behind demand remain strong. The CBU reports that real household incomes rose 9.2% in H1 2026, and real per capita incomes 7.3%, against real GDP growth of 8.5%. In its assessment, price growth has been moderate relative to economic activity and household incomes.
The Escrow Reform
The settlement reform was introduced under DP-246 of 10 December 2025, as announced by the Ministry of Justice. From 1 April 2026, payments under notarised sale contracts for real estate and motor vehicles must be made without cash. Under the system, the buyer's funds are held in a bank account and released to the seller only after notarisation.
The CBU's analysis of the reform is cautious. It notes that developers can no longer use buyers' advance payments as a low-cost source of financing, which may raise their funding costs, and that "an initial increase in construction costs and prices may be observed" before the market adapts. It adds that the international evidence on escrow's effect on house prices is not conclusive.
Property Supply Trends
A Market Built on Individual Houses
New supply in Uzbekistan is dominated, to a degree unusual for a fast-urbanising economy, by individually built houses rather than apartment blocks.
The NSC reports that 15.9 million square metres of housing were commissioned in 2025, up 2.8% on 2024. The split between houses and apartment buildings for 2025 has not yet been published. In 2024, individual houses accounted for 14.7 million square metres, or 95% of the total, while apartment buildings contributed just 739,100 square metres.
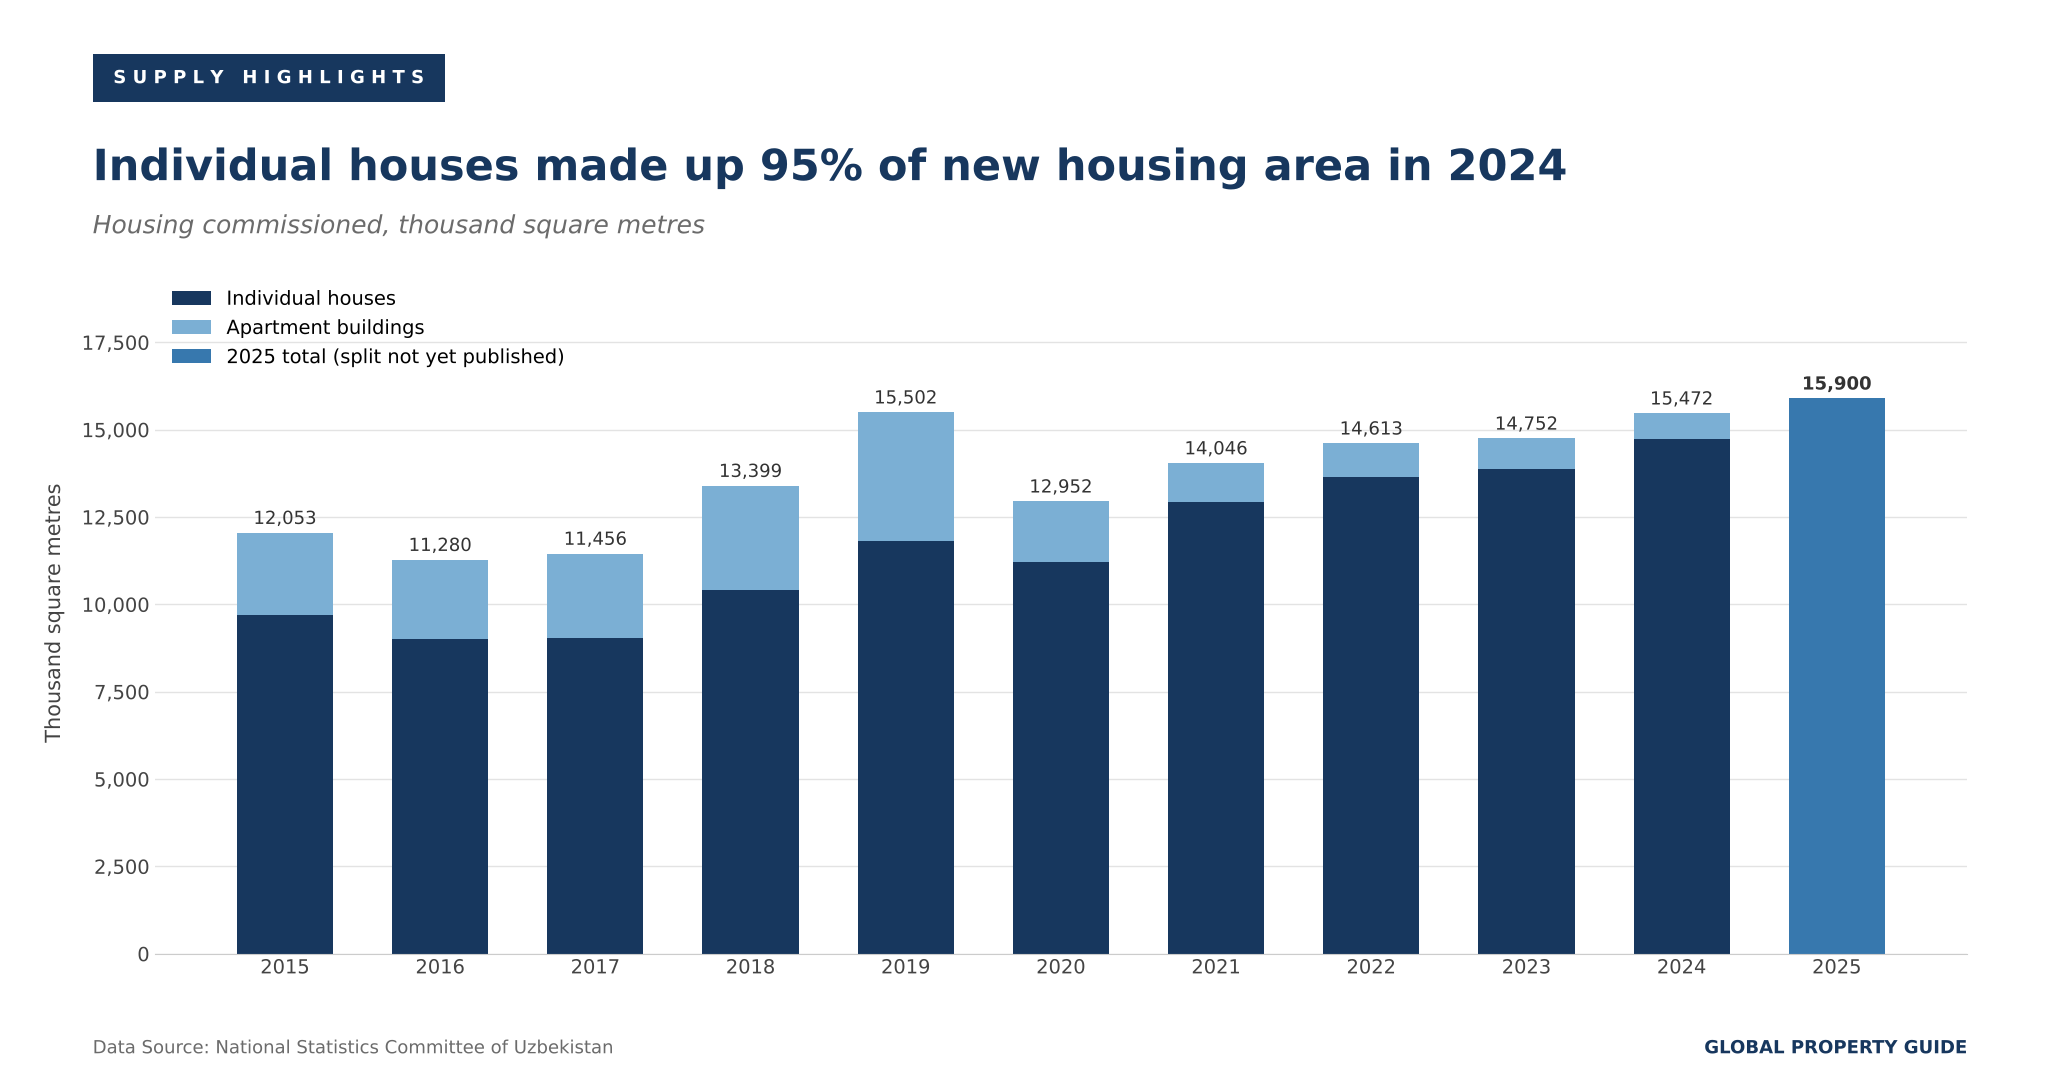
The trend in officially recorded apartment construction is striking. Apartment-building completions peaked at 3.68 million square metres in 2019 and have fallen in every year since, to 739,100 square metres in 2024, a decline of about 80%. Individual house completions rose over the same period from 11.8 million to 14.7 million square metres.
Completions Are Rising Again in 2026
Supply growth has picked up this year. In H1 2026, 7.7 million square metres of housing were commissioned, up 7.2% year-on-year. The CBU reports that completions per 1,000 inhabitants rose 5.4% to 200.7 square metres, and that the fastest growth came in Khorezm (up 22.9%), Tashkent city (up 21.5%) and Fergana (up 11.3%).
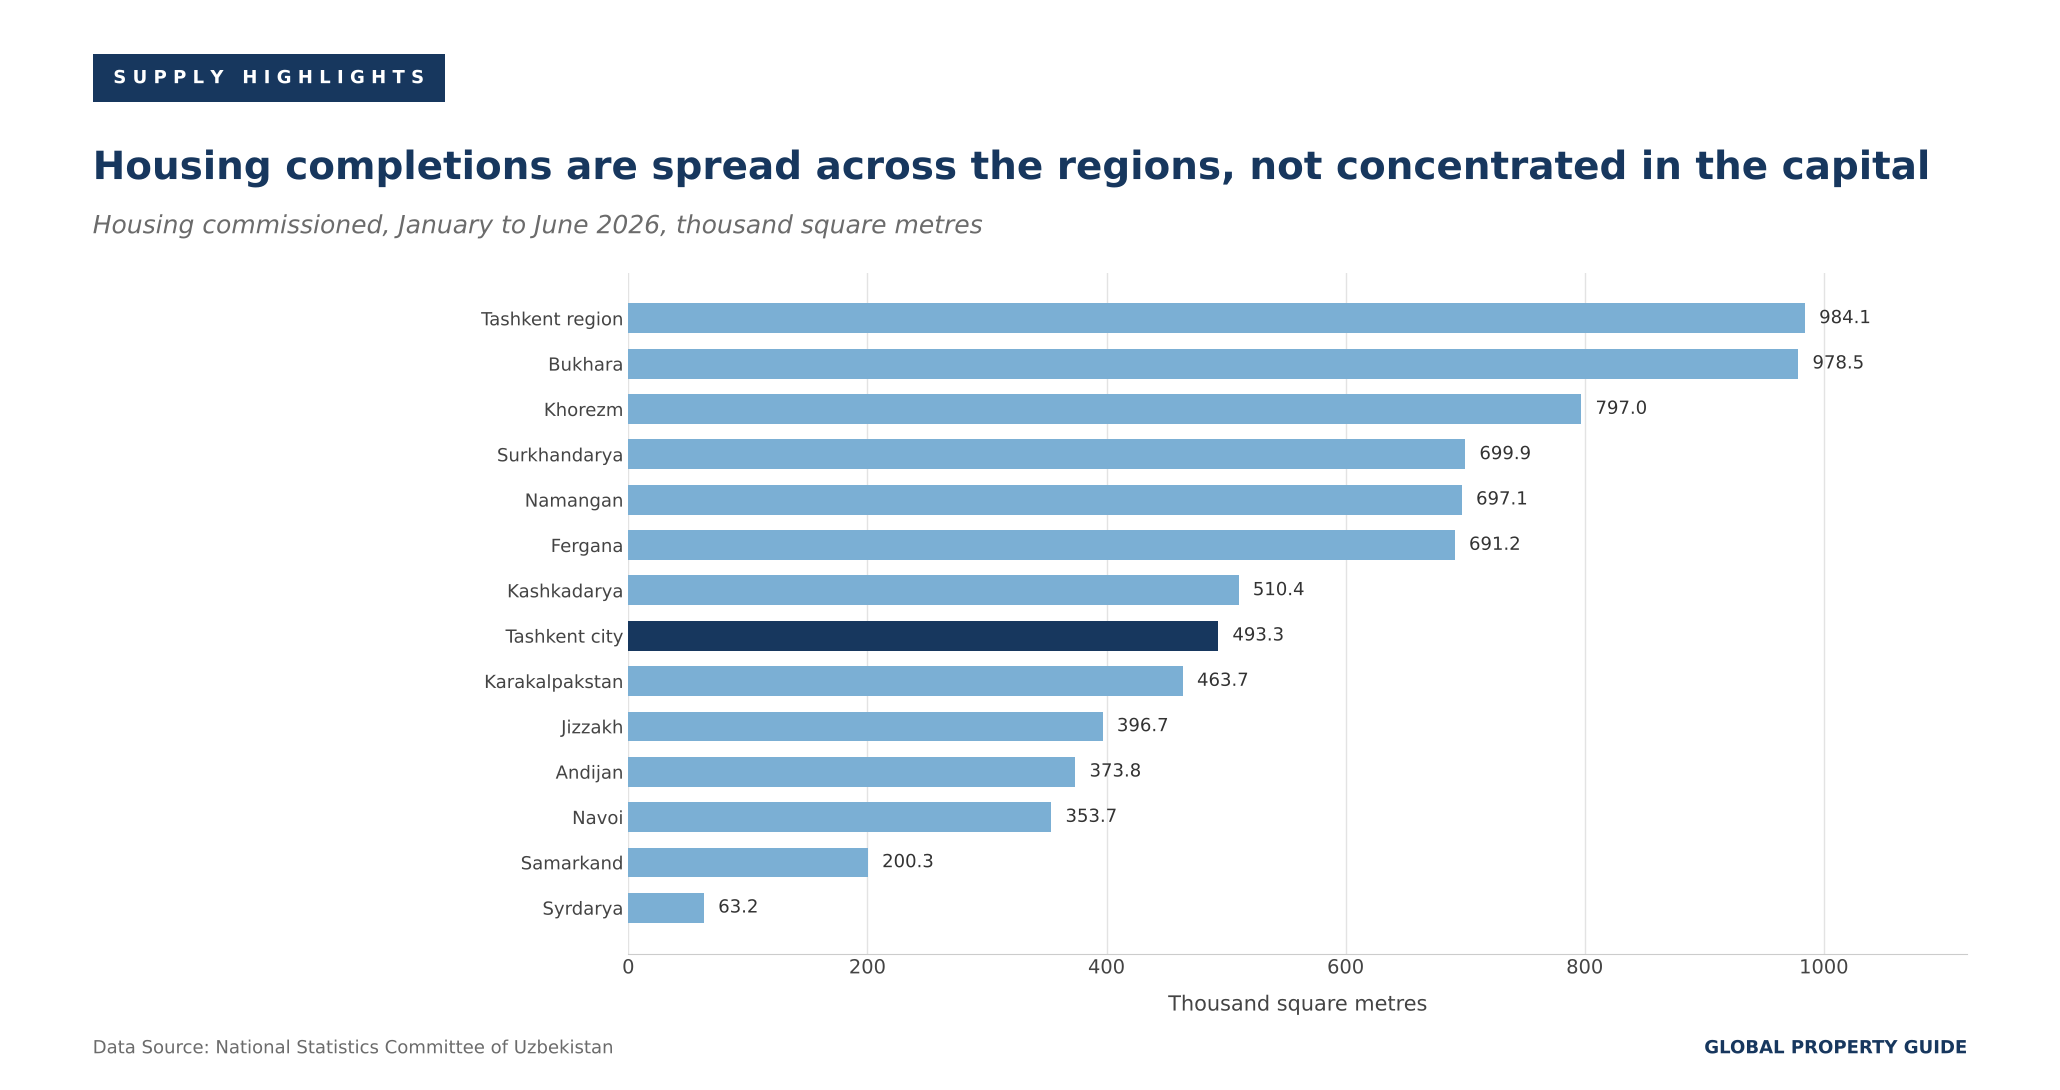
Completions are widely spread geographically. Tashkent region and Bukhara each commissioned close to a million square metres in the first half, while Tashkent city, at 493,300 square metres, ranked only eighth among the 14 regions.
Listing data point to a market where new supply is growing while the resale stock tightens. Between Q1 and Q2 2026, the number of primary-market listings on online platforms rose 5.5% and rental listings 4.9%, while secondary-market listings fell 4.8%.
Rental Market: Rents and Rental Yields
Rents Are Outpacing Prices
Rental demand remains strong, and rents are rising faster than sale prices.
According to the CBU, asking rents for apartments in multi-storey buildings rose 7.1% year-on-year in soums in June 2026, and 13.0% in dollars. In Tashkent, rents rose 5.8% in soums and 11.6% in dollars, with the average asking rent at about UZS 114,000 (USD 9.58) per square metre per month. The pace has accelerated through the year: in March, nationwide rents were up only 3.1% in soums and Tashkent rents 0.6%.
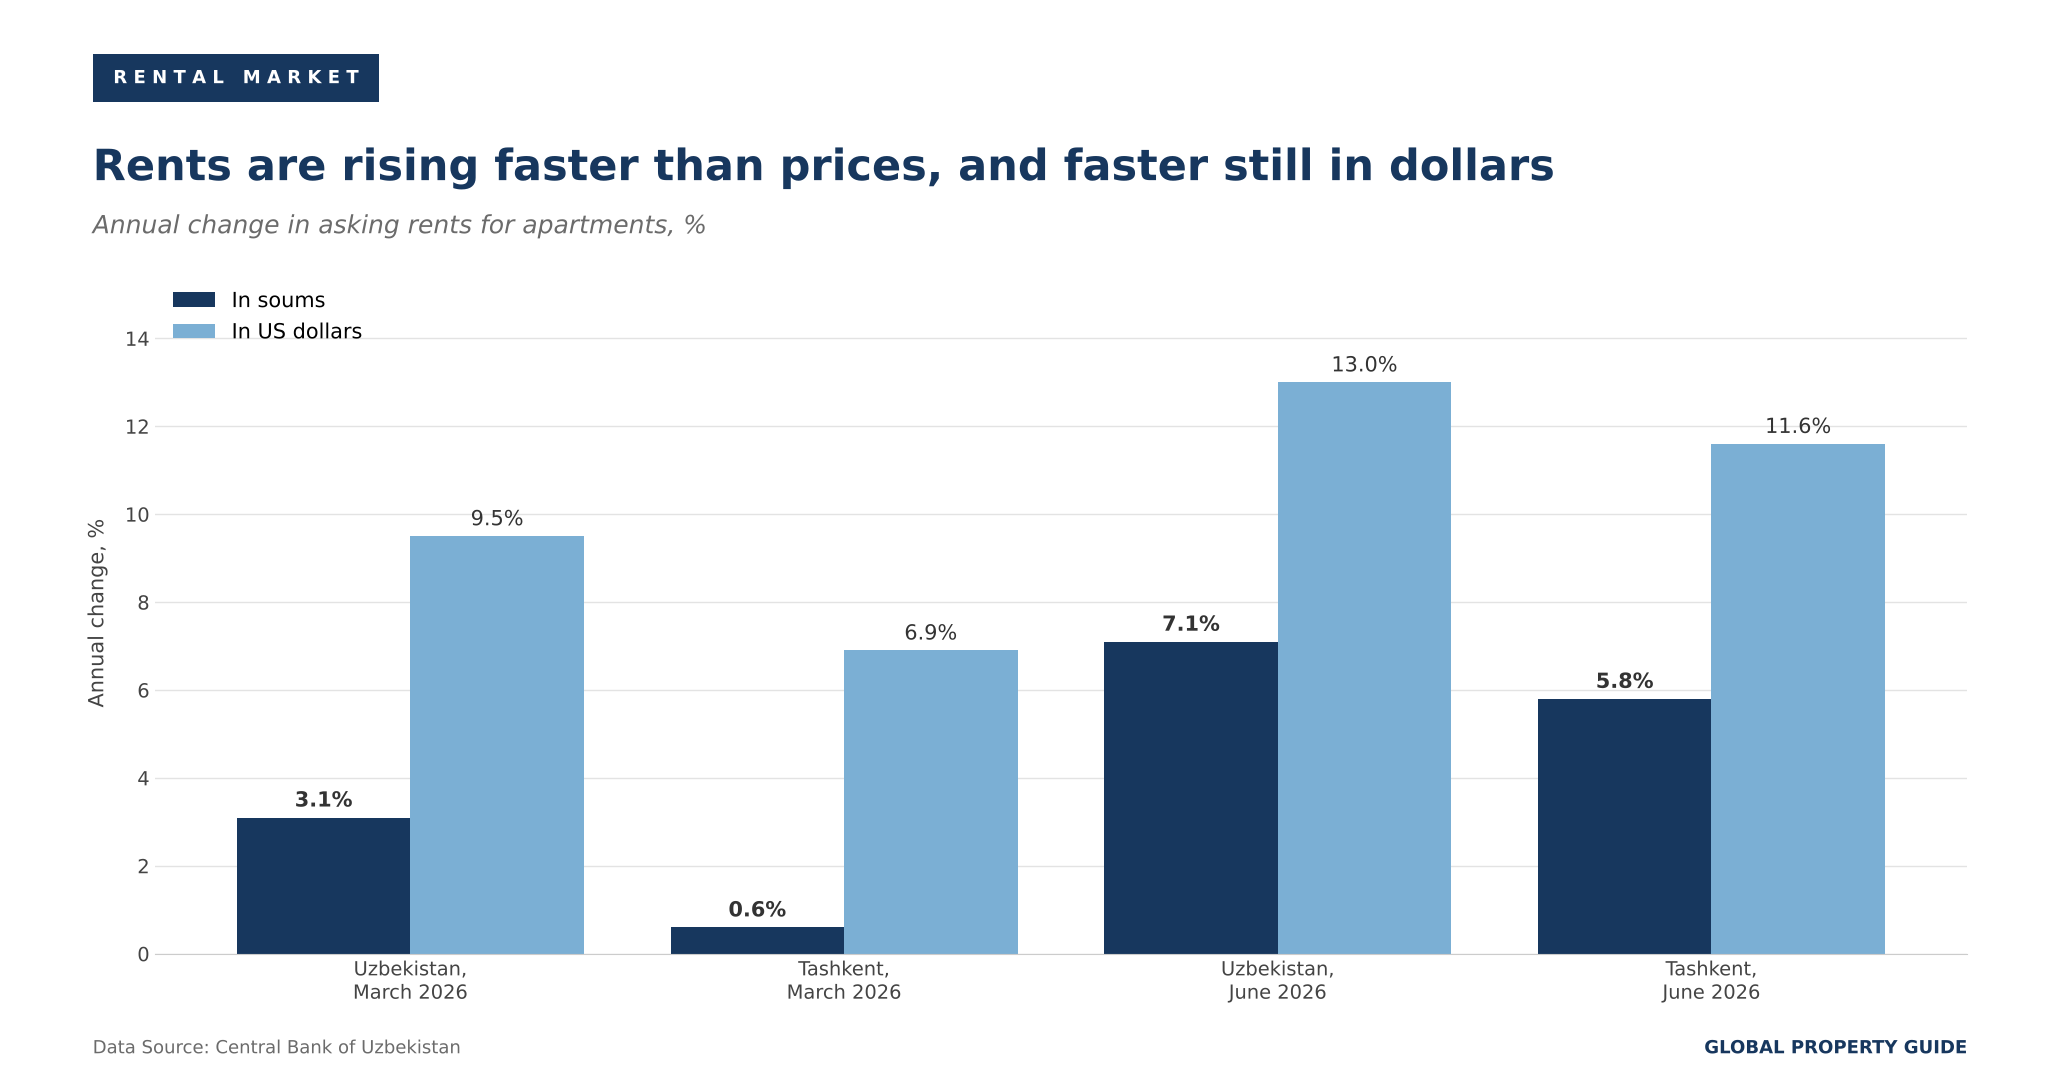
The CBU notes that rents kept rising even as the number of rental listings increased, a sign that demand is absorbing new supply. CERR reports that the highest rents in the capital are in the central districts of Shaykhontohur, Mirabad and Yakkasaray, at around USD 11 per square metre per month.
Rental Yields Are High by International Standards
Global Property Guide does not yet survey rental yields in Uzbekistan. CERR's own end-2025 averages, however, give an indication. With average rents in Tashkent of about USD 8.8 per square metre per month and secondary-market prices of about USD 1,100 per square metre, the implied gross rental yield in the capital is around 9.6%. This is an indicative figure derived from two citywide averages, not a like-for-like yield survey, and it should be treated with caution.
The direction of travel favours landlords. During 2025, Tashkent rents rose about 7% while secondary-market prices in the capital rose just 0.6%, so yields on resale property have been widening.
Land in Tashkent Is Getting Cheaper
Land plots in the capital are moving the other way. The CBU reports that the average asking price for 100 square metres of land in Tashkent city was about UZS 292 million (USD 24,542) in June 2026, down 9% year-on-year, which it attributes partly to more supply in outlying areas.
Mortgage Market and Interest Rates
Lending Is Booming Despite Rates Near 20%
Mortgage lending is the fastest-growing part of the market. The CBU reports that banks issued UZS 7.4 trillion (USD 622 million) in mortgage loans in Q2 2026, up 48% year-on-year, bringing the H1 2026 total to UZS 13.1 trillion (USD 1.10 billion), up 38%.
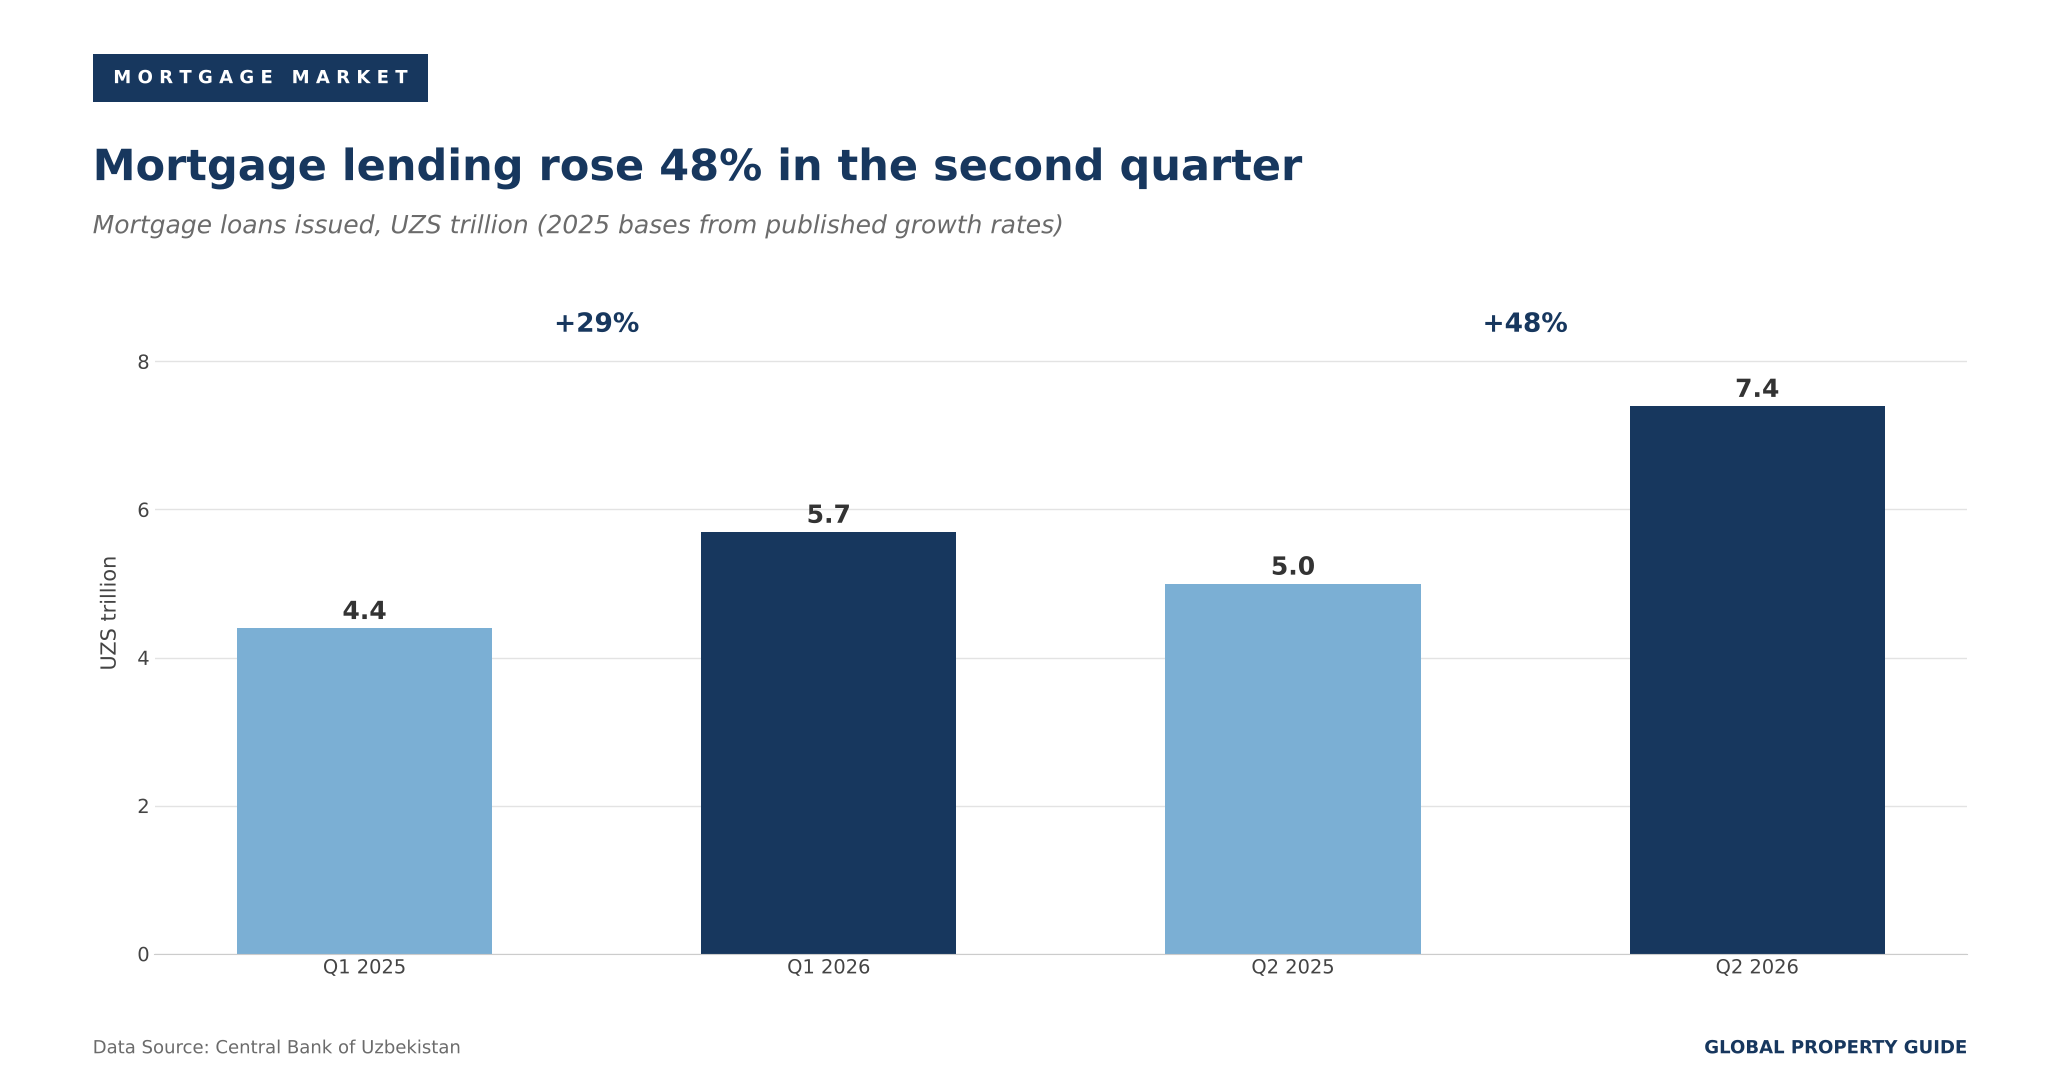
Over the first eight months of 2026, banks issued UZS 18.3 trillion (USD 1.54 billion) in mortgages to 59,200 borrowers, UZS 4.9 trillion more than in the same period of 2025, according to CBU data reported by Spot.uz. New construction dominates: 74% of the value, or UZS 13.6 trillion, financed purchases on the primary market, against 26% on the secondary market. The average loan works out at about UZS 309 million (USD 25,971). Tashkent city accounted for UZS 5.6 trillion, about 31% of the national total.
Borrowing Costs Remain Very High
Mortgage credit is expensive. Average mortgage rates between January and August 2026 ranged from 16.9% for loans funded from the republican budget, which are subsidised, to 20.7% for loans from banks' own funds and 21.6% for loans funded by the Uzbekistan Mortgage Refinancing Company.
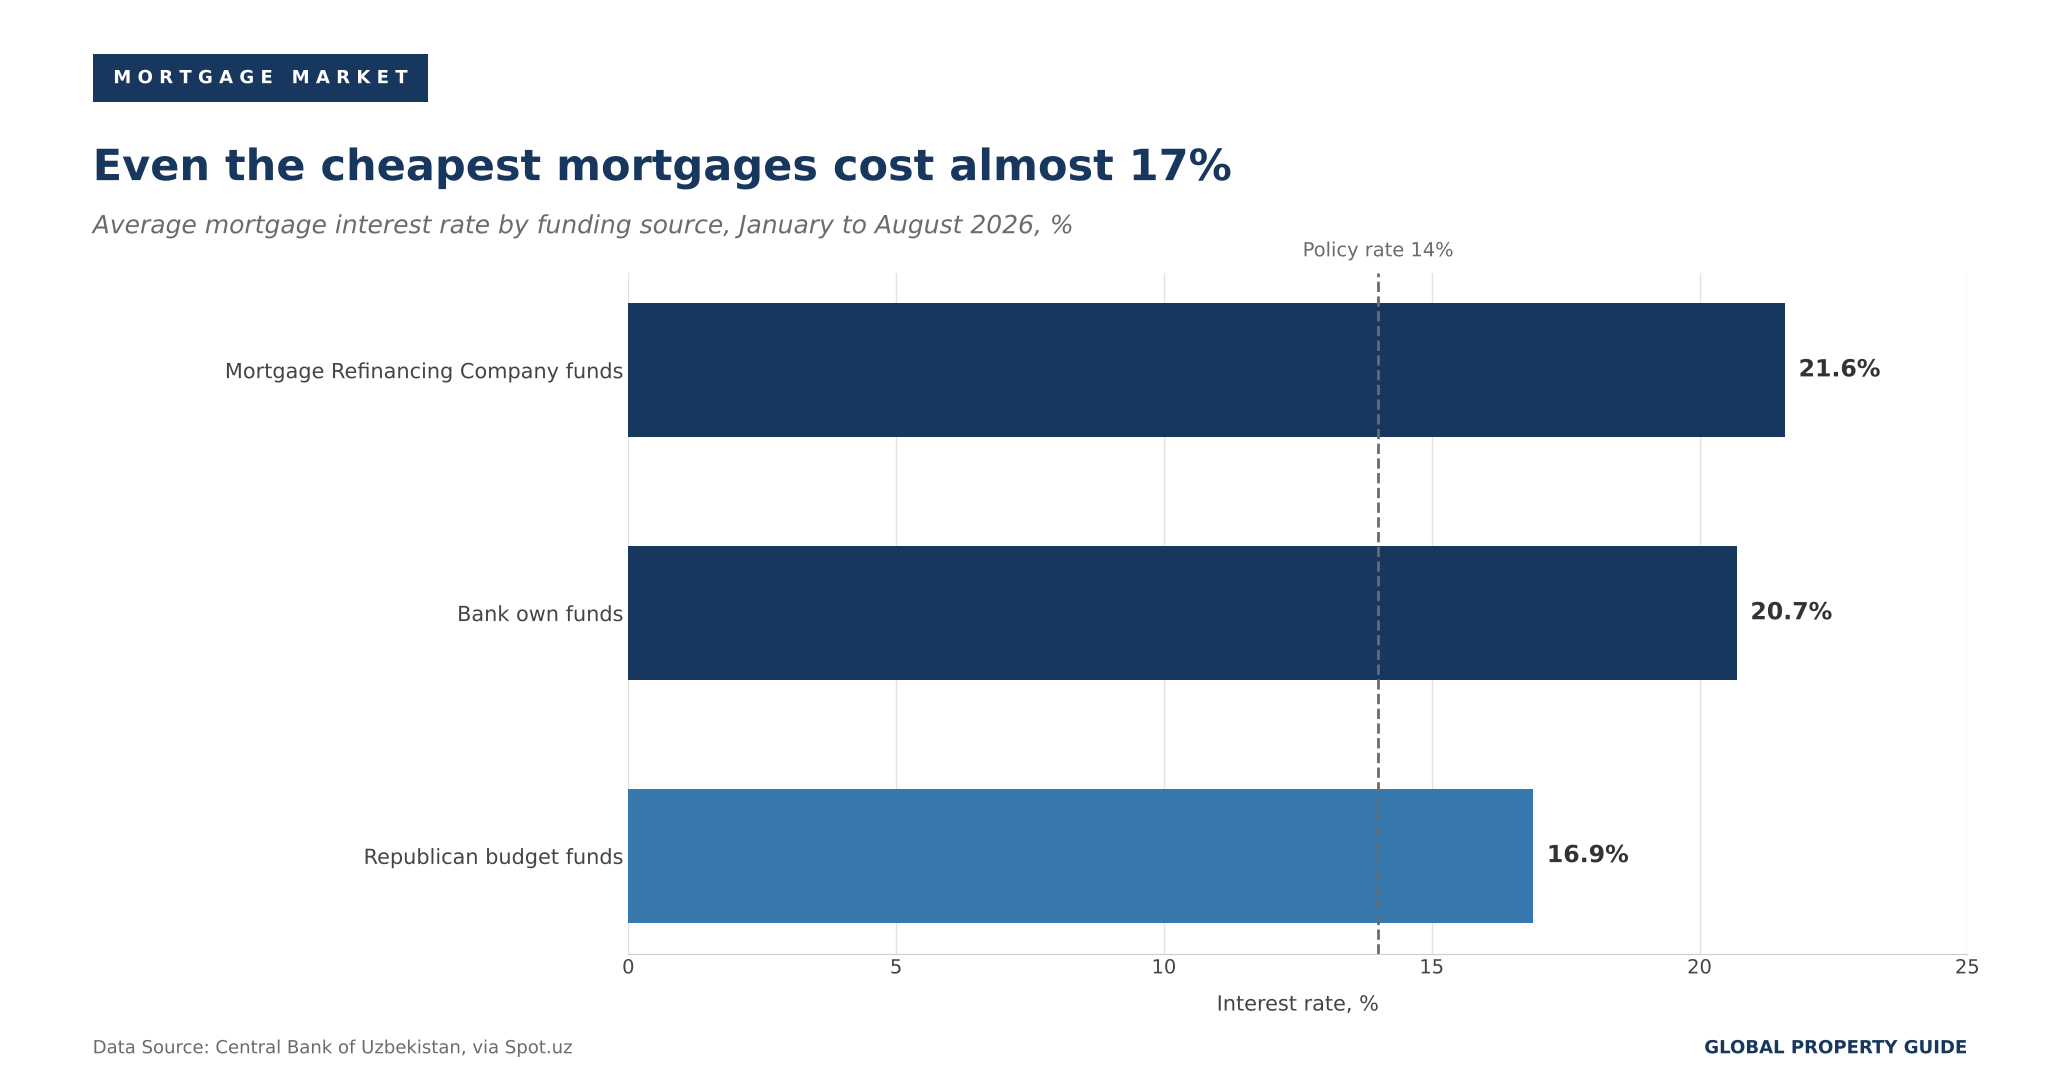
Against inflation of 6.4%, even the cheapest of these rates implies a real borrowing cost of almost 10%. That lending is growing this fast at such rates reflects both the pace of income growth and the importance of subsidised programmes, which keep the entry rate well below the market level.
The Central Bank Is Holding Firm
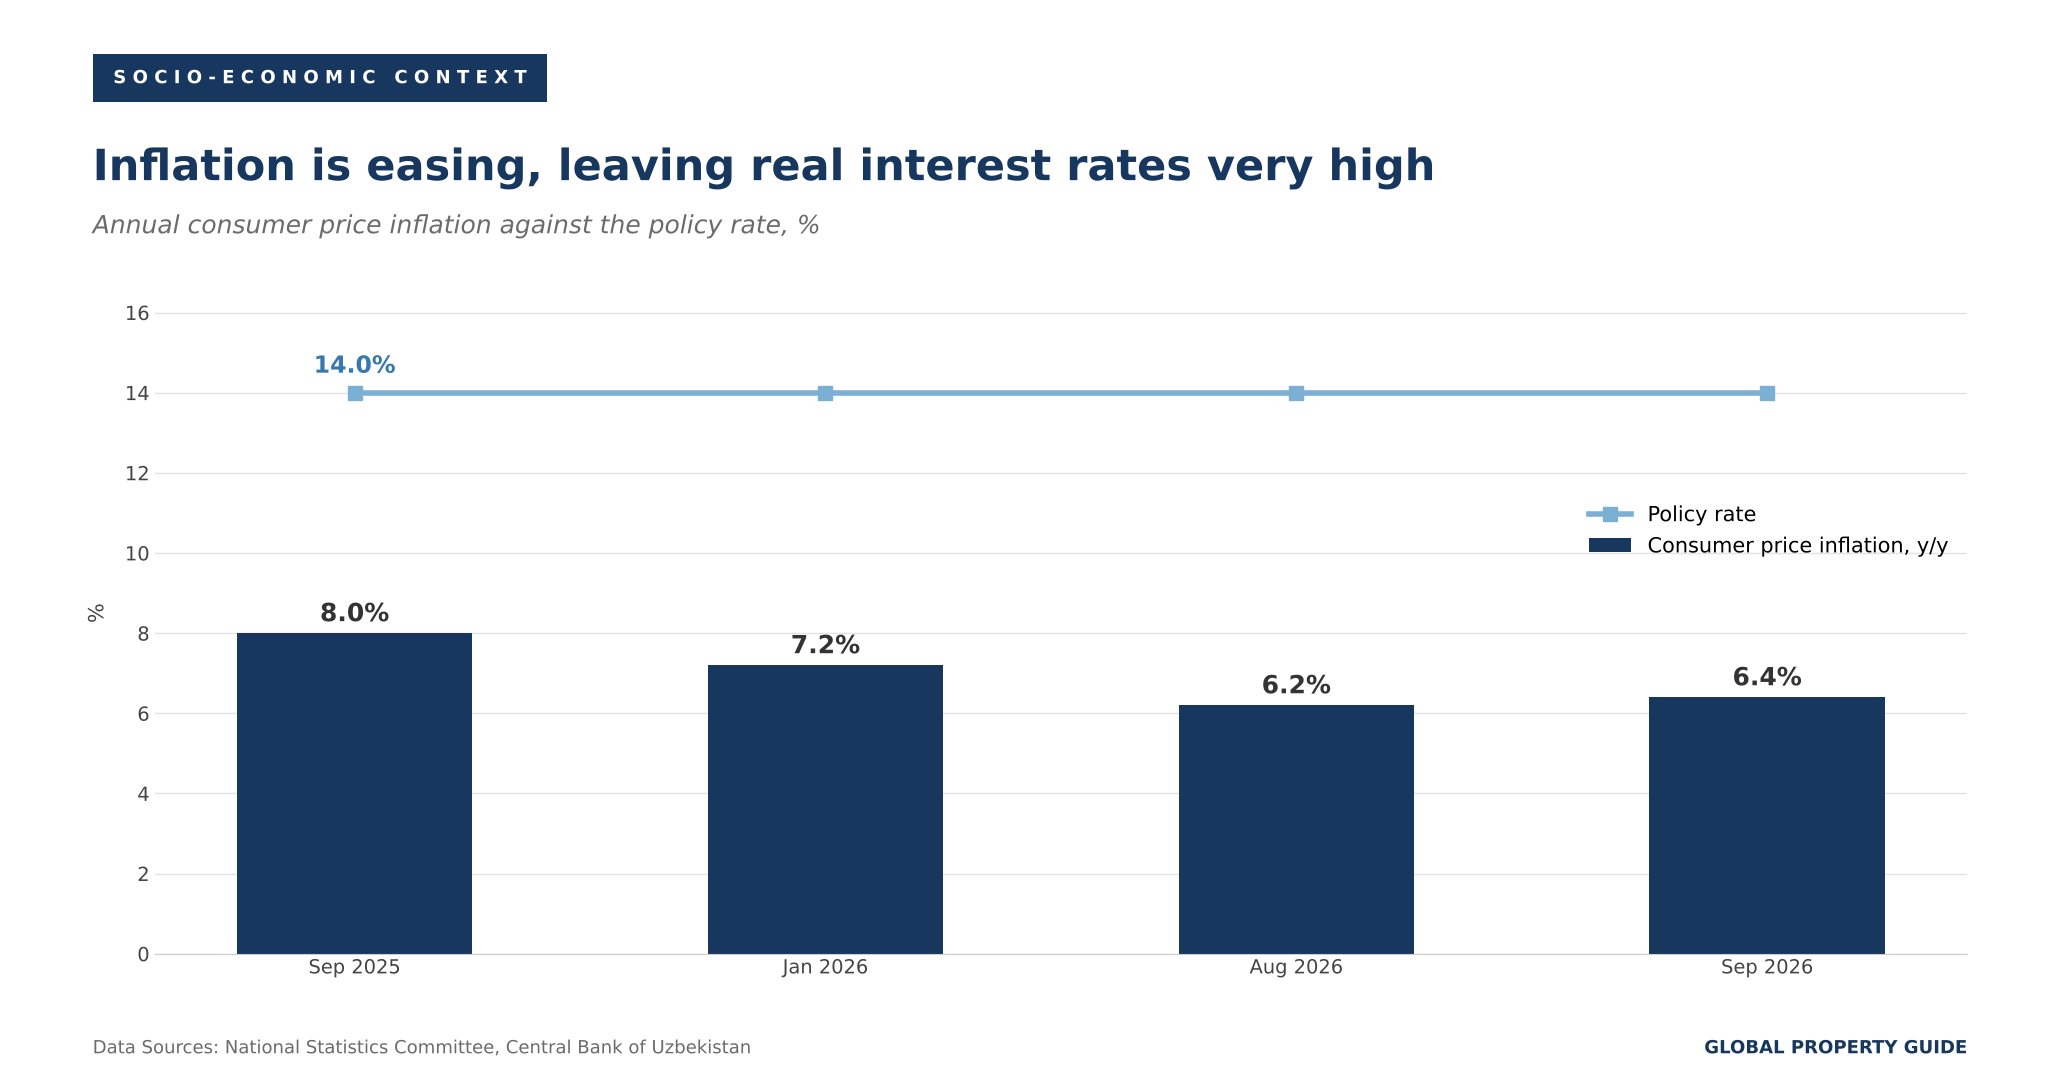
Monetary policy offers no near-term relief. The CBU raised its policy rate to 14% from 13.5% in March 2025 and has held it there since, most recently on 16 September 2026. With inflation at 6.4%, the real policy rate is about 7.1%. The next policy meeting is scheduled for 28 October 2026.
Economic and Social Factors
Fast Growth and Falling Inflation
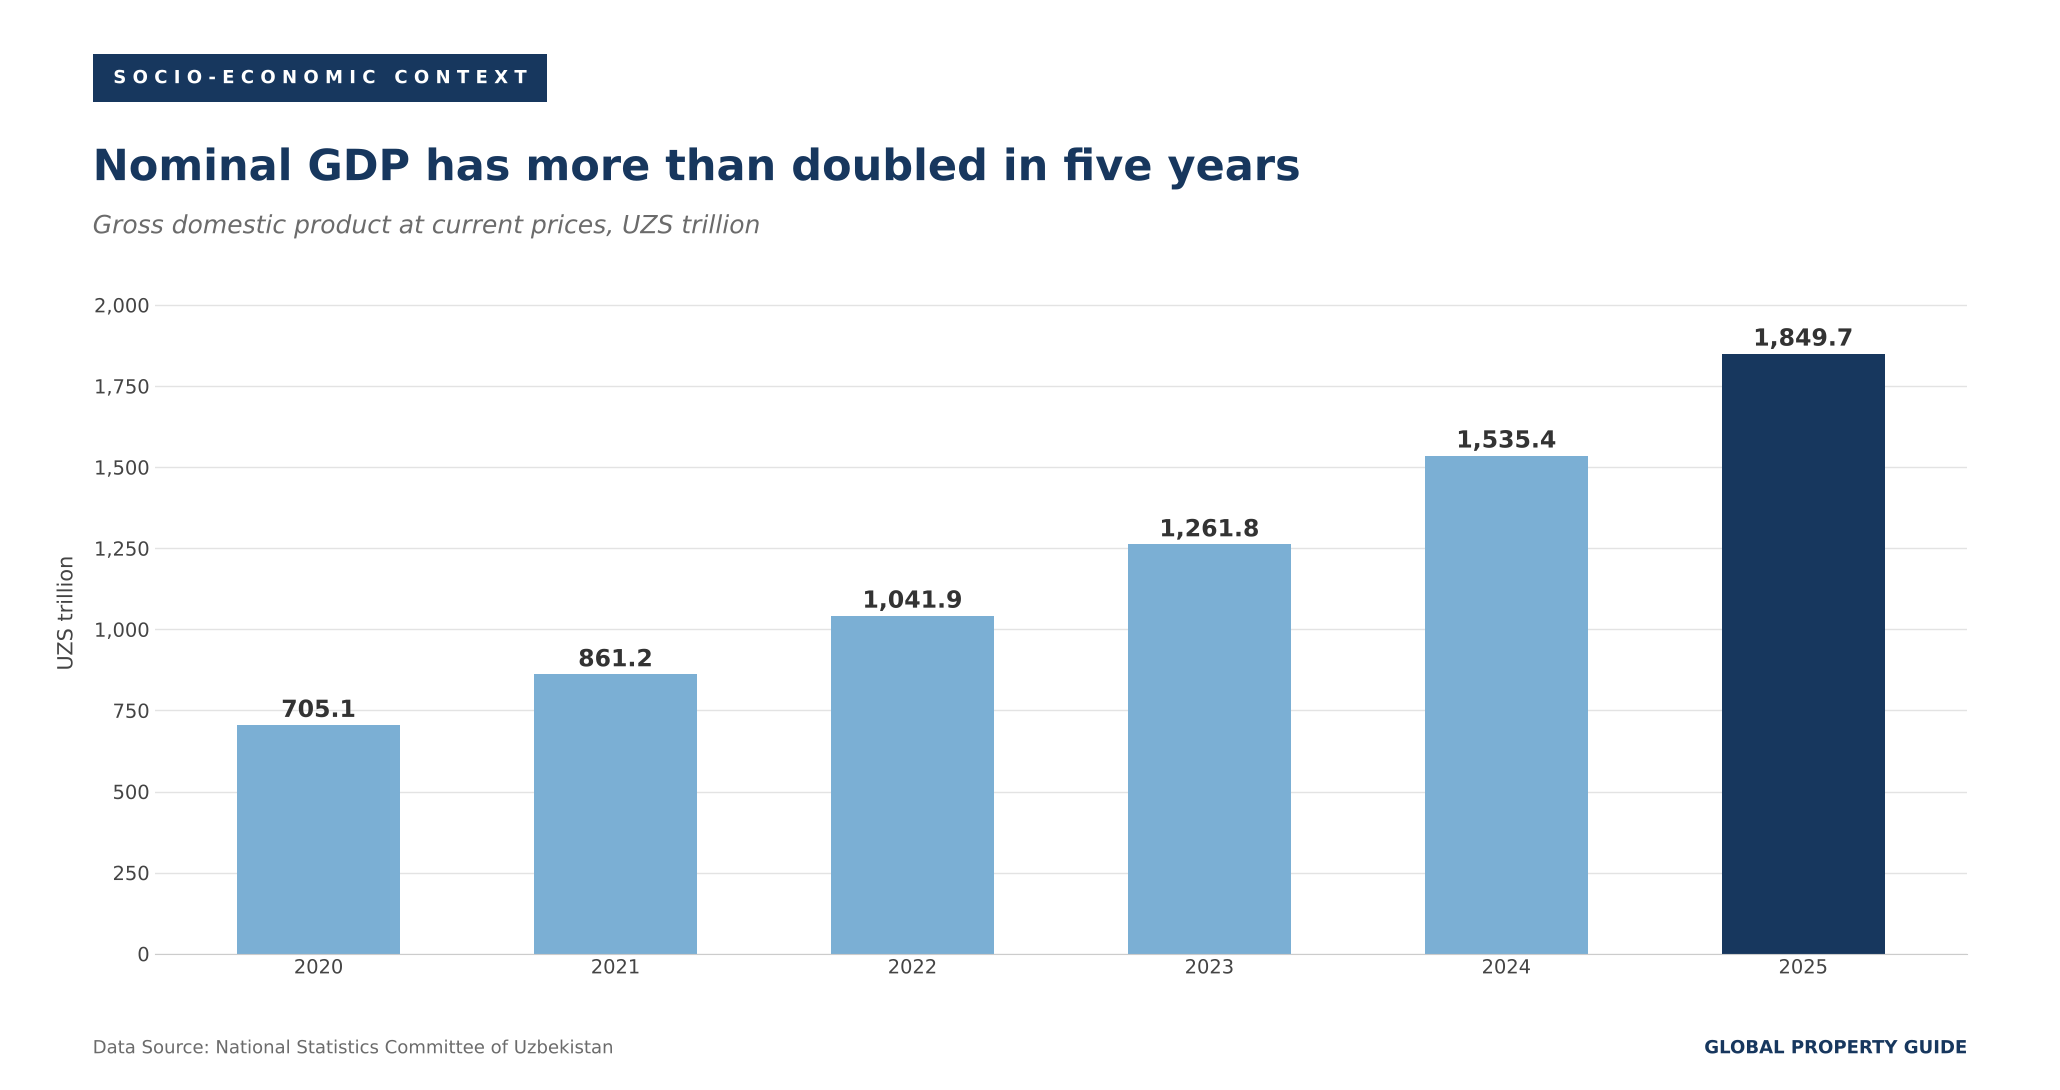
Uzbekistan's economy is growing rapidly. Real GDP rose 8.5% year-on-year in H1 2026, accelerating from 7.7% for the whole of 2025. Nominal GDP reached UZS 1,849.7 trillion in 2025, up 20.5% on 2024 and more than two and a half times its 2020 level.
Inflation Is Falling, but Slowly
Consumer price inflation has eased. According to the NSC, consumer prices rose 6.4% in the year to September 2026, down from 8.0% in September 2025 and 7.2% in January 2026, though slightly up from 6.2% in August. Housing-related costs are rising faster than the average: prices for housing services, water, electricity, gas and other fuels were up 11.8% over the year.
The Soum Has Strengthened
The soum has appreciated against the dollar. The CBU's own figures for housing prices, which rose about 6% in soums but about 12% in dollars over the year to June 2026, imply an appreciation of roughly 5.5% over that period. On 10 October 2026, the official rate was UZS 11,897.90 per US dollar, the rate used for all conversions in this article.
For foreign buyers, the strengthening soum has turned moderate price growth in local currency into double-digit gains in dollar terms over the past year. The main caveats are the short history of the new price index, borrowing costs near 20%, and a regulatory framework for property transactions that is still being reshaped, as the escrow reform shows.
Sources:
- National Statistics Committee of the Republic of Uzbekistan
- Residential Property Price Index in Uzbekistan for Q2 2026: stat.uz
- National Residential Property Price Index (2024 = 100%): siat.stat.uz
- National Residential Property Price Index (to the Previous Quarter): siat.stat.uz
- National Residential Property Price Index (to the Corresponding Quarter of the Previous Year): siat.stat.uz
- Dynamics of the Price Index in the Housing Market (Discontinued Series): siat.stat.uz
- On Changes to the Methodology for Compiling Residential Property Price Indices: stat.uz
- 15.9 Million Square Metres of Housing Commissioned in 2025: stat.uz
- 7.7 Million Square Metres of Housing Commissioned in H1 2026: stat.uz
- Total Area of Commissioned Individual Housing: siat.stat.uz
- Total Area of Commissioned Apartment Buildings: siat.stat.uz
- Consumer Price Index, September 2026: stat.uz
- GDP Grew 8.5% in H1 2026: stat.uz
- GDP Grew 7.7% in 2025: stat.uz
- Central Bank of the Republic of Uzbekistan
- Ministry of Justice of the Republic of Uzbekistan
- Payments for Real Estate and Motor Vehicle Transactions to Be Conducted in Cashless Form: gov.uz
- Center for Economic Research and Reforms (CERR)
- Real Estate Market Review, August 2026 (Spot.uz, RU): www.spot.uz
- Tendencies in the Real Estate Market Based on the Results of 2025 (Kun.uz): kun.uz
- Other
- Mortgage Loans Issued in January to August 2026 (Spot.uz, UZ): www.spot.uz
- Central Bank Reports Steady Growth in the Real Estate Market in Q3 2025 (Kun.uz): kun.uz
- Central Bank: Home Prices 17% Above True Value (Kun.uz): kun.uz