US house prices up by just 1.83% y-o-y in Q1 2019
After six years of strong house price growth, the U.S. housing market is now gradually cooling. The S&P/Case-Shiller seasonally-adjusted national home price index rose by just 1.83% during the year to Q1 2019 (inflation-adjusted) – the lowest growth since Q3 2012. House prices fell by 0.57% during the latest quarter. The Federal Housing Finance Agency's seasonally-adjusted purchase-only U.S. house price index increased 3.35% y-o-y in Q1 2019 (inflation-adjusted), a slowdown from a y-o-y rise of 4.98% in Q1 2018 and the lowest growth since Q3 2014. The FHFA index rose by a meager 0.81% q-o-q during the latest quarter.

Demand and construction activity are mixed.
Sales of new single-family houses were up 7% y-o-y to a seasonally-adjusted annual rate of 673,000 units in April 2019. In contrast, existing home sales fell by 4.4% y-o-y to 5.19 million units in April 2019. New housing starts fell by 2.5% y-o-y to a seasonally-adjusted annual rate of 1,235,000 units in April 2019, while completions were up 5.5% to 1,312,000 units. Building permits authorized for new housing units fell by 5% y-o-y to 1,296,000 units over the same period. U.S. homebuilder sentiment stood at 66 in May 2019, up from 63 in the previous month but down from 70 a year earlier.
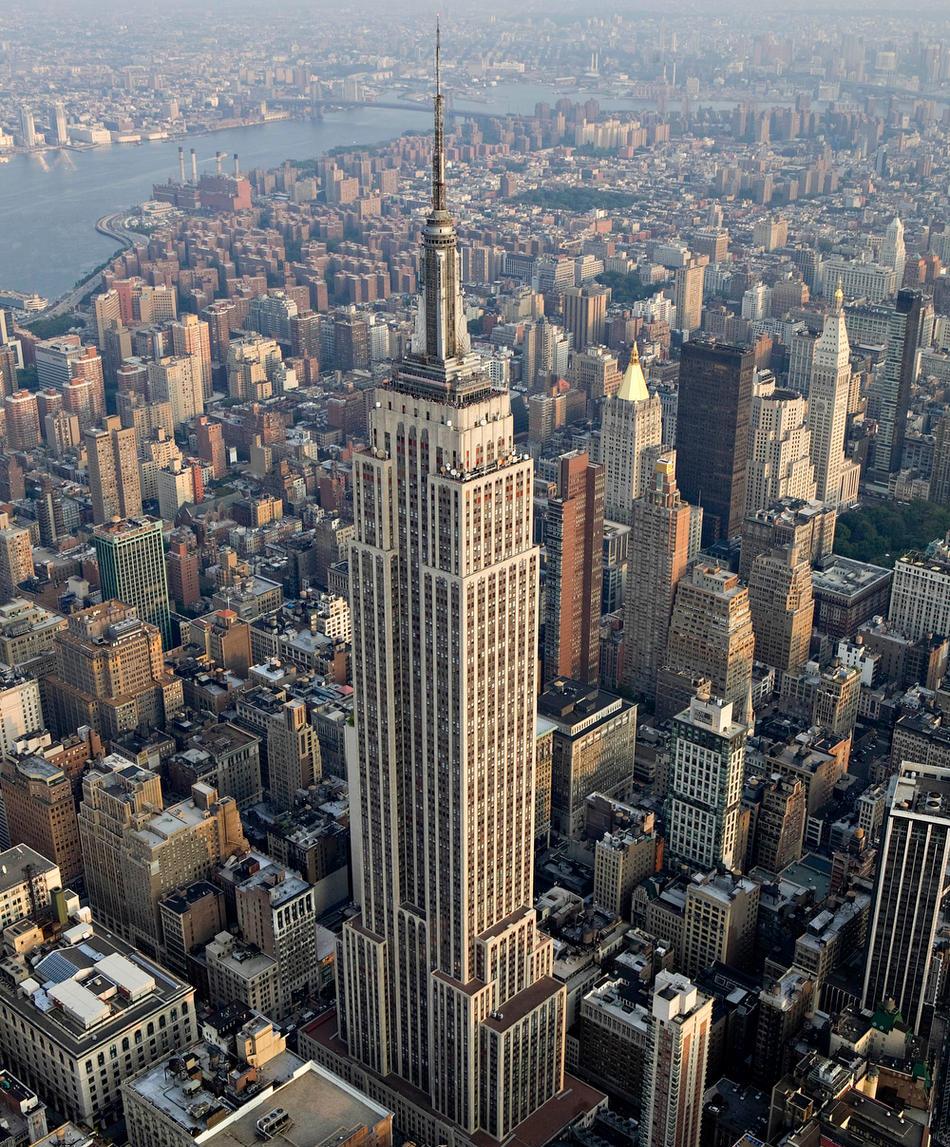
Rents, rental yields: poor yields in New York, at 2.91%
New York apartment costs are very high, at around $17,191 per sq. m.
| U.S.: typical city centre apartment buying price, monthly rent (120 sq. m) | |||
| Buying price | Rate per month | Yield | |
| New York | $2,037,340 | $4,942 | 2.91% |
Recent news: The U.S. economy grew by 3% in 2018 from a year earlier, up from an expansion of 2.2% in 2017 and actually the fastest pace since 2005, according to the U.S. Federal Reserve. However, the world’s biggest economy is expected to slow in the coming years, with projected GDP growth rates of 2.3% this year and 1.9% in 2020, mainly due to the ongoing trade war.