Estonia’s house prices continue to rise, albeit at a slower pace
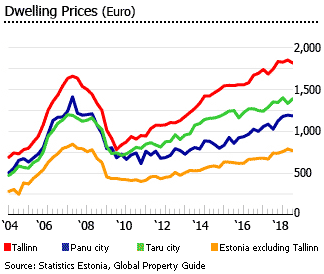
After seven years of strong house price rises, Estonia’s housing market is now cooling - mainly due to rising mortgage rates, as well as slowing economic growth.
Demand is now falling, yet residential construction continues to rise strongly.
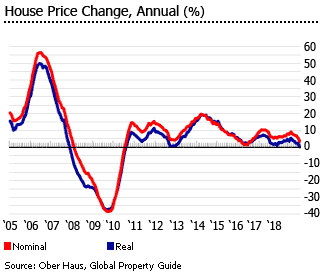
In Tallinn average price of apartments increased by a modest 3.48% to €1,843 per square metre (sq. m) in 2018, according to Ober Haus. In fact when adjusted for inflation, apartment prices in the capital city were almost unchanged in 2018 from the previous year.
Quarter-on-quarter, prices increased by a meagre 0.82% (1.06% inflation-adjusted) in Q4 2018.
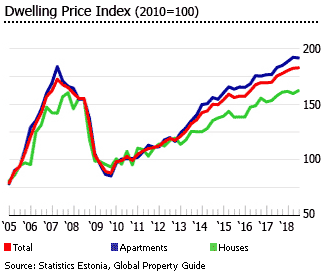
Nation-wide there were modest house price increases, according to Statistics Estonia. The average price of Estonian dwellings rose by 4.15% (0.58% inflation-adjusted) during the year to Q3 2018, the lowest annual rise since Q2 2016. During the latest quarter (Q3 2018) apartment prices increased by a minuscule 0.24% (-0.88% inflation-adjusted).
Over the same period, house prices rose by 1.62% (0.49% inflation-adjusted) while apartment prices fell 0.29% (-1.39% inflation-adjusted).
Most of the country’s major cities also experienced a deceleration in house price rises during the year to Q3 2018, according to Statistics Estonia:
- In Tallinn, Estonia’s capital, the average price of apartments increased 4.31% (0.73 inflation-adjusted), the slowest growth in the past nine quarters.
- In Tartu City, the second largest city and the intellectual capital of Estonia, apartment prices rose by 2.82% (-0.71% inflation-adjusted), from y-o-y rises of 3.42% in Q2 2018, 12.91% in Q1 2018, 7.78% in Q4 2017 and 6.3% in Q3 2017.
- In Parnu City, the country’s summer capital, located in the southwestern, apartment prices surged by 15.51% (11.55% inflation-adjusted), from annual rises of 9.96% in Q2 2018, 11.55% in Q1 2018, 12.51% in Q4 2017 and 0.1% in Q3 2017.
- In Estonia excluding Tallinn, apartment prices rose by 3.92% (0.36 inflation-adjusted), a sharp slowdown from a y-o-y rise of 10.63% in Q3 2017.
New apartments cost around €2,300 to €5,000 per sq. m. in the city centre and €1,500 to €2,200 per sq. m. in the residential districts.
Demand is now falling
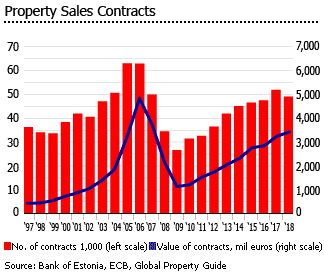
The number of purchase-sale contracts in Estonia fell by 5.5% to 48,925 units in 2018 from a year earlier, according to Estonian Land Board. In Tallinn, the number of purchase-sales contracts dropped 6.4% to 14,524 units over the same period.
Yet dwelling completions have soared, by no less than 15% y-o-y to 6,773 units in 2018. Building permits however have adjusted to current trends, by falling by 11.3% y-o-y to 6,990 units
The economy is slowing
Estonia’s economy grew by about 3.5% in 2018, a slowdown from last year’s expansion of 4.9%, according to the European Commission. The economy is expected to slow further, with projected GDP growth of 2.7% this year and 2.4% in 2020.
Foreign individuals and companies are allowed to acquire real estate with the permission of the local authorities. There are legal restrictions on acquiring agricultural and woodland of 10 hectares or more, and permission from the county governor is needed. Foreign individuals are not allowed to acquire land located in smaller islands, or listed territories adjacent to the Russian border.
A short history of the Estonian property cycle
Estonia’s housing market was in continuous boom from 2000 to 2007. The average price of 2-room flats in Tallinn rose by 448.7% from 2000 to 2007, in Tartu prices rose 431.5% and in Parnu 440%. Prices of three-room flats were equally impressive, rising 412% in Tallinn, 481% in Tartu, and 471.5% in Parnu.
Owner-occupancy rates rose strongly, up from 85% in 2002, to 96% in 2004. The rental market shrank from 12% of households (with 9% privately renting and 3% in social rents) in 2002, to just 4% in 2004.
Then came the crash. Estonia’s house price falls in 2008 were among the biggest in the world, rivaled only by Latvia. Prices of dwellings started to fall nationwide in 2007. House prices plunged by 32.11% in 2009, after falling by 20.96% in 2008, and by 0.38% in 2007. House prices fell further by 5.88% (-10.57% inflation-adjusted) in 2010.
Recovery began in 2011, with the average price of dwellings rising by 8.25% (4% inflation-adjusted). The housing market has strengthened since, with prices rising by an average of about 9.2% (7.1% inflation-adjusted) annually from 2011 to 2017.
HOUSE PRICE INDEX, ANNUAL CHANGE (%) |
||
| Year | Nominal | Inflation-adjusted |
| 2007 | -0.38 | -8.64 |
| 2008 | -20.96 | -26.97 |
| 2009 | -32.11 | -30.75 |
| 2010 | -5.88 | -10.57 |
| 2011 | 8.25 | 4.00 |
| 2012 | 9.47 | 5.53 |
| 2013 | 12.24 | 10.61 |
| 2014 | 7.14 | 7.64 |
| 2015 | 8.07 | 8.66 |
| 2016 | 9.74 | 8.35 |
| 2017 | 9.17 | 5.17 |
| Sources: Statistics Estonia, Ober Haus, Global Property Guide | ||
Estonia’s housing market is expected to slow this year, amidst rising mortgage rates and slowing economic growth, according to local property experts.
Fewer sales, but at higher prices
Demand is mixed. In 2018, the number of purchase-sale contracts fell by 5.5% to 48,925 units from a year earlier, according to Estonian Land Board. In contrast, the value of contracts rose by 5.5% to €3.42 billion over the same period. This only implies that fewer units were sold, but at higher prices
During 2018:
- In Tallinn, the number of purchase-sales contracts fell by 6.4% while the value of contracts increased 4.1%.
- In Tartu, the number of purchase-sale contracts rose slightly by 1.8% while the value of contracts surged 19%.
- In Parnu, the number of purchase-sale contracts dropped 6.5% and the value of contracts fell by 3.8%.
- In Estonia, excluding Tallinn, the number of purchase-sale contracts fell by 5.1% while the value of contracts rose by 6.9%.
Construction activity continues to increase
After the break-up of the Soviet Union in 1991, housing construction in Estonia dramatically decelerated. In 2001 housing construction began to pick up, peaking at around 7,000 per year in 2007, but after the financial crisis completions slumped to around 2,000 per year.
Dwelling completions began to rise in 2014, growing by 32.6% y-o-y to about 2,756 units, then soaring in 2015 by 44% to 3,969 units, in 2016 by 19.2% to 4,732 units and in 2017 by another 24.5% to 5,890 units.
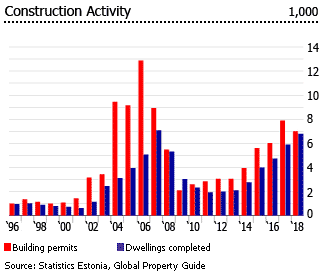
In 2018, dwelling completions surged again by 15% from the previous year, to 6,773 units.
Moderate to good rental yields
Gross rental yields from apartments in Tallinn are moderate to good, ranging from 5.3% to 6.3%, according to a Global Property Guide research conducted in October 2018. This was supported by OberHaus, whose research finds that gross rental yields of apartments in Tallinn ranged from 5% to 5.5%, depending on location and the quality of the property.
Smaller apartments tend to earn higher rental returns. A 40 sq. m. apartment has moderate to good rental yields at 6.3%, whereas a 120 sq. m. apartment earns somewhat poorer rental yields at 5.3%.
The average rent for a 40 sq. m. apartment in Tallinn was €384 per month, whereas for a 120 sq. m. apartment, monthly rents were around €1,145 in September 2017, according to Global Property Guide. Average rents per sq. m. are around €9.4 per month.
Mortgage rates are rising gradually
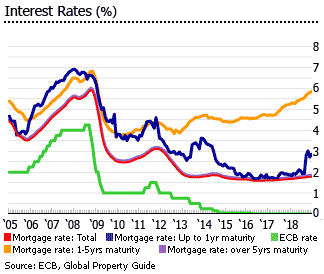
In December 2018, the average interest rate on outstanding housing loans was 1.88%, up from 1.77% a year earlier and 1.69% two years ago, according to the European Central Bank (ECB).
By original maturity:
- Up to 1 year: 2.85%, up from 1.88% in December 2o17 and 1.7% in December 2016
- Over 1 and up to 5 years: 5.85%, up from 5.24% a year earlier and 4.71% two years ago
- Over 5 years: 1.85%, up from 1.73% in December 2o17 and 1.66% in December 2016
In September 2014, the ECB slashed the key rate to a record low of 0.05%. Then in March 2016 the ECB cut again the key rate to zero where it has remained since.
Mortgage market expanding
The size of the mortgage market in 2018 was equivalent to 30.8% of GDP.
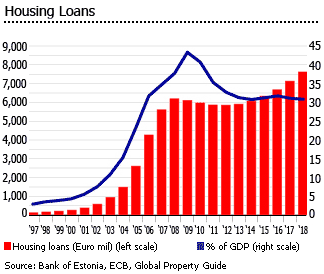
Estonia’s original house price boom was supported by a massive expansion of the mortgage market which grew by an average of 62% yearly from 2002 to 2006. After 2007, the mortgage market collapsed.
In 2014, housing loans outstanding rose by 2.8% from a year earlier, and total value of outstanding housing loans has risen by 4.4% in 2015, by 5.4% in 2016, and by another 6.8% in 2017, based on figures from the Bank of Estonia. In December 2018, the value of housing loans outstanding rose strongly by 7% to about €7.63 billion from the same period last year.
Economic growth slowing but unemployment continues to fall
Estonia’s economy grew by about 3.5% in 2018, a slowdown from last year’s expansion of 4.9%, according to the European Commission.
The economy is expected to slow further, with projected GDP growth of 2.7% this year and 2.4% in 2020. But the jobless rate was only 5.4% in 2018, the lowest level since 2008, as reforms encouraged pensioners to re-enter the labor market. In Q3 2018, average monthly gross wages and salaries stood at €1,291, according to Statistics Estonia.
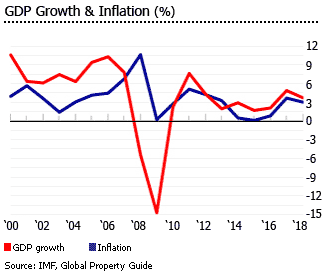
From 2000 to 2006, Estonia’s economy expanded by an average of 8% annually, including 7.7% growth in 2007, resounding 10.3% GDP growth in 2006, and 9.4% growth in 2005. Unemployment fell from 14.6% in 2000, to just 4.6% in 2007.
The economy then contracted by a staggering 14.7% in 2009, following a decline of 5.4% in 2008, amidst the global financial crisis.
It recovered with astounding growth of 7.6% in 2011, with strong exports. Then in 2012, it expanded by a robust 4.3%, but only 1.9% in 2013, and2.9% in 2014, 1.7% in 2015, and 2.1% in 2016, mainly due to a sharp slowdown in the electronics sector and shale oil sector, and a decline in demand from neighboring Russia.
In 2017, Estonia’s economy expanded by a robust 4.9%, a sharp improvement. As a result, unemployment fell to 5.8% in 2017.
Nationwide inflation stood at 3.4% in 2018, unchanged from the previous year. Inflation is projected to slow to 2.8% this year and to 2.3% in 2019, according to the European Commission.
Estonia has the lowest national debt level in the European Union, at just about 8.8% of GDP in 2018. The government deficit was 0.5% of GDP last year.
Sources:
- Key economic indicators (Bank of Estonia): http://statistika.eestipank.ee/#/en/p/MAJANDUSKOOND
- MFI aggregated balance sheet (European Central Bank): https://sdw.ecb.europa.eu/browse.do?node=9691115
- Bank interest rates (European Central Bank): https://sdw.ecb.europa.eu/browse.do?node=9691123
- Economic forecast for Estonia (European Commission): https://ec.europa.eu/info/business-economy-euro/economic-performance-and-forecasts/economic-performance-country/estonia/economic-forecast-estonia_en
- Yields rising in Estonia (Global Property Guide): https://www.globalpropertyguide.com/Europe/Estonia/Rental-Yields
- World Economic Outlook Database October
- 2018 (International Monetary Fund): https://www.imf.org/external/pubs/ft/weo/2018/02/weodata/index.aspx
- ’18 Real Estate Market Report (Ober Haus): https://www.ober-haus.lt/wp-content/uploads/Ober-Haus-Market-Report-Baltic-States-2018.pdf
- Baltic Price Index (Ober Haus): http://ober-haus.com/rinkos_apzvalgos/baltic-price-index/
- Unemployment rate (Statistics Estonia): https://www.stat.ee/stat-unemployment-rate
- Dwelling completions (new construction), quarters (Statistics Estonia): https://www.stat.ee/371457